- December 21, 2023
- December 14, 2023
- November 30, 2023
- November 16, 2023
- November 2, 2023
- October 19, 2023
- October 12, 2023
- October 5, 2023
- October 2, 2023
- September 7, 2023
- August 3, 2023
- July 27, 2023
- July 20, 2023
- July 13, 2023
- June 29, 2023
- June 16, 2023
- June 08, 2023
- May 22, 2023
- May 18, 2023
- April 25, 2023
- April 17, 2023
- April 10, 2023
- April 3, 2023
- March 23, 2023
- March 16, 2023
- March 9, 2023
- January 30, 2023
- January 26, 2023
- January 19, 2023
- January 6, 2023
December 21, 2023
Product updates
Connection map visualization
You can now visualize your location data as sequences of points that are connected by a line in a new Google Maps visualization, called a combo map.
Learn more about connection maps.
Add value to reference line or reference band label
You can now choose to display the value of a reference line or the value range of a reference band in visualizations.
Stepped lines for time series charts, line charts, and combo charts
You can now choose stepped lines for time series charts and for line charts and combo charts.
Updates to New Search Ads 360 connector field names
The display names for several fields in the New Search Ads 360 data source have been updated.
- Google Ads conv. value / cost -> Actual ROAS
- Cost / Google Ads conv. -> Google Ads actual CPA
- Google Ads conv. value / click -> Conv. value / click
- Value / Google Ads conv. -> Value / client account conv.
- Google Ads conv. rate -> Client account conv. rate
New connections to the New Search Ads 360 data source will use the new display names. Existing connections to the New Search Ads 360 data source won't be affected. You can also manually update the display names for existing data source connections.
December 14, 2023
Product updates
Table chart improvements
You can now use the following options in table charts:
- Transpose the table
- Freeze one or more columns
- Resize row height
Schedule delivery controls in Workspace admin console
As a Google Workspace or Cloud Identity administrator, you can control where users in your organization can send Looker Studio content.
Custom grouping
The new Group calculated field type lets you create ad hoc custom groups for dimensions without needing to develop CASE WHEN expressions in calculated fields or logic in SQL.
November 30, 2023
Product updates
Updated Looker Studio Terms of Service
We've updated the Terms of Service with the following changes:
- This Agreement does not apply to your use of Looker Studio Pro, which is made available under the Google Cloud Platform Agreement.
- 12.11 “Google Cloud Platform Agreement” means the agreement that governs Customer’s use of Google Cloud Platform (as described at https://cloud.google.com/terms/services).
November 16, 2023
Product updates
Pivot table metric limit increased to 20
You can now have up to 20 metrics in a pivot table.
Learn more about pivot tables.
Label fields available in the New Search Ads 360 connector
You can now include the following New Search Ads 360 fields in your reports:
- Label (Account)
- Label (Campaign)
- Label (Ad group)
Learn more about the New Search Ads 360 connector.
November 2, 2023
Product updates
Pro feature: Create alerts on a chart
Report viewers can set up an alert on a chart in a Looker Studio report that will notify the alert creator and chosen recipients when the chart data meets the conditions specified in the alert.
Learn more about creating alerts on a chart.
View underlying data available to all users
Looker Studio and Looker Studio Pro users can view the data that is available in any chart in a tabular form. This can help you make the best decisions about what to include in the chart. Viewing the underlying data can also help you troubleshoot problems with your reports.
Learn more about viewing a chart's underlying data.
Quick filters available to all users
Originally released as a Looker Studio Pro feature, Looker Studio users can also use quick filters to easily change how the data in the report is filtered without changing the report configuration for other users.
Learn more about quick filters.
New function: NATIVE_DIMENSION
The NATIVE_DIMENSION function lets you create Google BigQuery SQL expressions in your BigQuery data sources.
Learn more about the NATIVE_DIMENSION function.
Set a default viewport for Google maps
You can now set and return to a default location and zoom level on a Google map visualization.
Learn more about the default viewport setting.
Drag and tilt Google Maps
With enabled tilt and optimized graphics, you can now tilt and rotate Google Maps visualizations. You can tilt a combo map visualization to display a map layer in three dimensions.
Learn more about vector graphics and map tilting.
New map visualization: Combo map
You can now combine the properties of a filled map and a bubble map in a new Google Maps visualization called combo map. Combo maps have vector graphics and three-dimensional display features that are enabled by default.
October 19, 2023
Product updates
Table Drilling and Table Tooltips
The Drill Actions experience for table charts provides an updated drill experience for report creators and report viewers. With the new Drill Actions menu, report creators can perform the following tasks:
- Add more than one dimension for users to Drill Up, Drill Down, or swap between dimensions for different insights into the data that is presented in table charts.
- Set up Drill Through links to external URLs to provide users with quick navigation to additional context about the data that is presented in table charts.
With the new table chart Drill actions tooltip, report viewers can perform the following tasks:
- More intuitively Drill Up, Drill Down, or swap between dimensions for additional context of the data presented in table charts.
- Select Drill Through links to navigate to external sites that provide additional context about the data that is presented in table charts.
Visit the Drill into your data article for more information about the report viewer experience, and visit the Add drill actions to charts article for more information about setting up drill actions.
Visualize your Apigee API analytics data in Looker Studio
Apigee is a platform for developing and managing APIs. The Looker Studio Apigee connector lets you create reports and dashboards that are based on analytics and monetization data and share them with stakeholders and customers.
Learn more about the Apigee connector.
October 12, 2023
Product updates
Set auto refresh on a report
As a report editor, you can configure a report to automatically refresh data, at a predefined cadence, as long as the report is open. This feature helps ensure that business decisions leverage the most up-to-date data.
Pro feature: Looker Studio Mobile app
Use the Looker Studio mobile app to access your data on the go.
October 5, 2023
Product updates
New control type: Dimension control
The dimension control lets report viewers change the dimension on one or more charts without needing to edit the report.
New field available in Google Ads connector
You can now specify an Asset Group Name field for a Google Ads data source when using the Google Ads connector.
October 2, 2023
Product updates
BigQuery native integration in Looker Studio
BigQuery native integration in Looker Studio enables new monitoring features for Looker Studio queries, improves query performance, and supports many BigQuery features. This feature is in preview.
Upgrade to Looker Studio Pro
You can subscribe to Looker Studio Pro directly by using our self-service upgrade tool.
Looker Studio Pro gives you all the features of Looker Studio that you already know, plus enhanced enterprise capabilities and access to technical support from Google Cloud Customer Care.
Learn more about Looker Studio Pro.
September 7, 2023
Product updates
Pro feature: View a chart's underlying data
Viewing a chart's underlying data can help you make the best decisions about what data to include in that chart, and can also help you troubleshoot problems with your reports.
Learn more about viewing a chart's underlying data.
Move and delete assets in bulk
You can select multiple Looker Studio assets at once to move or delete. For example, you can move more than one report from Owned by me to a team workspace, or delete multiple items from the Trash simultaneously.
Learn more about adding and removing team workspace assets.
August 3, 2023
Product updates
New chart type: Boxplot chart
The new Boxplot chart lets you visualize the distribution and spread of values in your dataset.
New chart type: Candlestick chart
The new Candlestick chart lets you visualize ranges in your data, including opening and closing values, and the highs and lows of each range.
New chart type: Waterfall chart
The new Waterfall chart lets you visualize how a sequence of positive and negative values adds up to a total.
Improved thumbnail images
Thumbnails display a fixed size image of 320 px X 240 px, and if possible, present a view of the entire report page. Previously, thumbnails only showed a portion of the page.
Learn more about thumbnail images.
July 27, 2023
Product updates
Line improvements
New line improvements let you customize the look and functionality of lines in Looker Studio charts. Improvements include:
- Reference bands that let you compare data against a range of values on your charts
- Vertical reference line support for Area and Time series charts
- Line style options that let you customize the appearance of lines in your charts
- Moving average trend line that lets you visualize a moving average calculation of the data on your charts
Improved single select option for list controls
The Single select option in drop-down and fixed-size list controls requires you to choose only one option from the list. Previously, you could de-select all options in the control, which returned all values. Now, you can select one and only one value when this option is enabled.
Learn more about list controls.
Documentation updates
New Looker Studio Pro article: Best practices and tips for using team workspaces
The Best practices and tips for using team workspaces article describes best practices, tips, and use cases for working with team workspaces. This article provides guidance for creating and using team workspaces efficiently and confidently and sharing content only as necessary, as well as examples of common naming conventions and scenarios.
July 20, 2023
Product updates
Pro feature: Add a quick filter
Quick filters provide a flexible, ad hoc way to explore your data. Use quick filters to easily change how the data in the report is filtered without changing the report configuration for other users.
Learn more about quick filters.
Pro feature: Get a personal report link
A personal report link creates a copy of your report that is only accessible to the person who opens the link. Changes made to either the original or the private report will not affect the other report.
Learn more about personal report links.
Intervals for time series charts
You can add intervals to time series charts to show how much uncertainty there is in your data. Intervals can be represented as shaded bands (area intervals), boxes, lines, or other shapes, depending on the interval type you specify.
To add an interval to a time series chart, select the Add an interval option in the STYLE section of the properties panel.
Changes to Google Ads creative assets reporting
The Google Ads connector for Looker Studio is aligned with the public Google Ads API for creative assets reporting.
To return accurate results when using Clicks and/or Impressions metrics in combination with creative asset dimensions, be sure to also include Ad Type and Asset ID dimensions in your chart. Otherwise, the chart may show inaccurate results.
Charts that aren't correctly configured will display a message that warns you about the invalid combination of dimensions and metrics.
Documentation updates
New Explore topic in the Help Center
You can find content that is related to exploring, analyzing, and filtering your data in the new Explore topic. New and existing content on filters, controls, and chart interactions lives in this topic.
July 13, 2023
Product updates
Pro feature: Scheduled delivery using Chat
Looker Studio Pro users can schedule reports to be delivered using Google Chat. You can send reports to individual recipients or to entire Chat spaces.
Pro feature: Filter by email address for scheduled reports
Looker Studio Pro users can add row-level security to the data in a report scheduled to be delivered through email.
Learn more about Chat delivery and filter by email address.
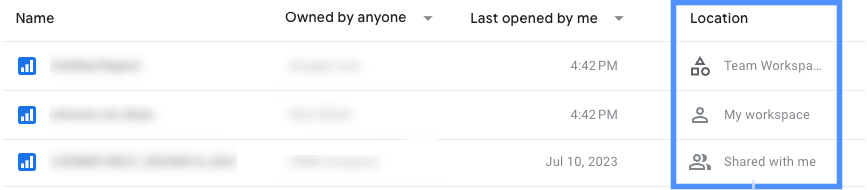
See report and data source location on the home page
The Location field on the Looker Studio home page shows where your Looker Studio assets live. For free Looker Studio users, you can see if a report or data source is owned by you or has been shared with you. For Looker Studio Pro users, you'll see whether the asset lives in your My Workspace, lives in a Team Workspace, or has been shared with you directly.
June 29, 2023
Product updates
Improvements to bar and combo charts
You can configure the following options for bar charts and combo charts with bars from the Style tab of the properties panel:
- For stacked bar charts, 100% stacked bar charts, and combo charts with stacked bars, you can choose between the default Metric value label type and the Stacked label type. For stacked bar charts, you can also choose the Total label type.
- You can use the Bar label position setting to specify the position of the bar label relative to the bars or columns in the chart.
- In the Chart spacing section, you can define custom spacing between bars and groups of multiple bars.
- You can select the Bar border color icon to choose a custom color for bar or column borders.
Learn more about bar charts and combo charts.
Audit logging for team workspaces
You can now view Team Workspace log events in the Admin Console (Security Investigation Tool). To see these events, filter the log by choosing Team Workspace as the asset type.
Learn more about Looker Studio log events.
Firewall and database IP address change
As announced on July 14, 2022, the IP addresses used by Looker Studio to connect to the following databases have changed:
- Amazon Redshift
- MySQL
- PostgreSQL
- Microsoft SQL Server 2017
The IP addresses to use are:
- 142.251.74.0/23
- 2001:4860:4807::/48 (Optional, for platforms that support IPv6)
You may close any of the previously listed addresses. They are no longer used by Looker Studio.
June 16, 2023
(Updated 2023-06-16 9:20 AM PDT)
Product updates
GA4 API dimensions/metrics
New Google Analytics 4 data sources that you create get their fields directly from the GA4 API. Previously, GA4 data sources were based on a fixed schema with a predefined list of fields. To see new fields from the GA4 API in an existing data source, refresh the fields.
Note: This update is backwards compatible with the previous version of the connector. Refreshing a Google Analytics 4 data source will preserve the existing schema and simply add new API fields to the data source.
Learn how connect to Google Analytics.
Documentation updates
Updated Connect to Google Analytics. Added information and links about the GA4 schema change, and the deprecation of Universal Analytics. Removed information about connecting to Universal Analytics.
June 08, 2023
Product updates
Dynamic links in navigation buttons
You can configure the URL of a navigation button to be provided dynamically from a dimension value. Learn more.
May 22, 2023
Product updates
Running percentage delta
You can apply a running percentage of delta calculation to metrics in a chart. This calculation applies the following formula:
(current value - previous value) / ABS(previous value)
To apply a running calculation to your chart, follow these steps:
- Edit your report.
- Select a chart.
- On the right, in the properties panel, select the SETUP tab.
- Add a metric to the chart, and then click its edit pencil
.
- Click the Running calculation menu, and select the desired function.
For example, the following table shows the percentage change in class attendance for 1 week. Day 1 attendance is 95 , while day 2 attendance is 101. The running percentage delta calculation for day 2 is:
(101 - 95) / ABS(95)= 6.32%.
Learn more about running calculations.
May 18, 2023
Product updates
Pause report updates
You can pause updates to minimize the number of data requests made while building and editing your report. While the report is paused, changes made to the report's data settings are placed on hold until you resume updates. Pausing report updates can potentially save on query costs because Looker Studio only requests the data needed to meet the report configuration as of the time you resumed updates.
Learn more.April 25, 2023
Bug fixes
We fixed an issue that prevented users from connecting to PostgreSQL version 14.
Public issue tracker.
Documentation updates
Updated PostgreSQL connection information. If you wish to enable client authentication, note that Looker Studio expects the key to be in PKCS-8 format.
April 17, 2023
Product updates
Scorecard improvements
Scorecard visualizations include the following options:
- Sparklines show historical trends for a scorecard value over time.
- Progress visuals show the progress of a scorecard value towards a goal.
- You can compare the scorecard metric to a time period, target value, or metric.
Documentation updates
Updated pivot table limit
Pivot tables can render up to 500,000 cells of data, however, depending on the data set and dimensions and metrics involved in the table, performance may degrade. You can apply a filter to the pivot table to reduce the amount of data being rendered.
(Previously, the limit was incorrectly stated as 50,000 rows.)
April 10, 2023
Product updates
Scheduled delivery improvements
We've launched these new features for scheduled delivery of your reports:
Pro feature: multiple delivery schedules
Looker Studio Pro customers can add up to 20 email delivery schedules to a report. Each schedule can go to different recipients and have different settings. Learn more.
Filters in scheduled delivery
You can customize the filters and date ranges applied to scheduled reports. Learn more.
Send now
You can send a report via email immediately with the Send now feature. Learn more.
New chart type: sankey visualization
Sankey charts display a flow from one set of values to another and are effective for analyzing movements of information over time. Learn more.
Add buttons to your reports
Buttons let you customize and streamline the way your customers interact with chart filters, actions, and navigation.
Zoom and pan on charts
Zooming and panning can help you focus on specific areas of a data-dense visualization, such as when you want to highlight a portion of your data or review more granular details. Learn more.
April 3, 2023
Product updates
PostgreSQL 13 & 14 support
You can now connect Looker Studio to PostgreSQL versions 13 and 14. Learn more about connecting to PostgreSQL.
YouTube connector bug fix
We fixed a bug that could cause you to see different data from the YouTube connector than what you'd see in YouTube Analytics. Now the data should be the same in both places. Learn more about connecting to YouTube analytics.
March 23, 2023
Product updates
Align both axes to 0 option in Cartesian charts
You can align left and right axes to zero in Cartesian line, bar, and combo charts that have left and right Y-axes. This option is useful when you want to compare sets of data that contain a mix of positive and negative numbers.
Here's an example: the chart on the left is not aligned to 0, while the chart on the right is aligned to 0.
Google Ad Manager: Deprecation of the Verified categories dimension
The Verified categories dimension is deprecated in the Historical report. We've replaced Verified categories with the equivalent dimension, Advertiser vertical, in saved reports.
March 16, 2023
Product updates
More improvements to field search in the data panel
Searching for a field in the report editor's data panel is contextual:
- When no components are selected, you can search for fields in any data source that is added to the report.
- When a component is selected, the search results are restricted to that component's data source.
- When a group of components is selected, the search results are restricted to the grouped component's data sources.
When you search for a field, the data panel provides additional information about the results:
- The number of matches for each data source on the report appears on the right.
- The text matching your search appears in bold.
- If a data source doesn't contain your search term, a message appears below that data source.
Documentation updates
Updated database connector articles
Added the note that custom queries in Looker Studio may timeout after 3 to 5 minutes to all database connectors that support custom queries.
Updated PostgreSQL connector article
Added a note that the PostgreSQL connector doesn't use the Cloud SQL proxy when connecting to Cloud SQL PostgreSQL instances. If you're connecting to a Cloud SQL PostgreSQL instance, you'll need to add the listed IPs to the authorized networks list.
March 9, 2023
Product updates
New / renamed fields in the Google Analytics 4 connector
The following fields are available in the GA4 connector:
- Items added to cart
- Items checked out
- Items clicked in list
- Items clicked in promotion
- Items viewed
- Items viewed in list
- Items viewed in promotion
The following fields have been renamed:
| Old name | New name |
|---|---|
| Add-to-carts | Add to carts |
| Item purchase quantity | Items purchased |
| Item list clicks | Item-list click events |
| Item list views | Item-list view events |
| Item promotion clicks | Promotion clicks |
| Item promotion views | Item view events |
| Item views | Item view events |
To see these fields in your reports, refresh the data source.
Documentation updates
Updated: Connect to BigQuery
Added a note that custom queries in Looker Studio may timeout after 3 to 5 minutes.
Deleted: Connect to Google Surveys
Google Surveys and Surveys 360 were turned down in November 1, 2022. Creating new data sources based on Google Surveys has not been possible since that time.
Learn more about why Surveys was turned down.
January 30, 2023
Product updates
Identify Looker Studio queries with BigQuery job labels
All queries sent by Looker Studio to BigQuery have the BigQuery job label requestor:looker_studio.
You can use this job label to identify BigQuery queries related to Looker Studio. See viewing job labels for instructions.
Documentation updates
Article: Set up organizational ownership of Looker Studio Pro assets
Clarified that Looker Studio Pro assets are protected from accidental deletion by applying a Google Cloud lien.
January 26, 2023
Product updates
Looker connector generally available
The Looker connector allows you to access Looker data within Looker Studio by adding an Explore as a data source to a Looker Studio report.
Learn more about Connecting to Looker Studio from Looker.
January 19, 2023
Product updates
Improved field search in the report editor
Searching for a field in the data panel only searches the currently selected component's data source. When no components are selected, search looks for fields in any data source that is added to the report.
January 6, 2023
Product updates
Connect to Cloud SQL for MySQL instances that use private IP connectivity
The Cloud SQL for MySQL connector now supports connections to Cloud SQL for MySQL instances with private IP connectivity.
To allow Looker Studio to access data in Cloud SQL and make queries against this data over a private connection, select the Private path for Google Cloud services option in your Cloud SQL for MySQL instance settings.