- December 10, 2020
- December 3, 2020
- November 19, 2020
- November 12, 2020
- November 5, 2020
- October 29, 2020
- October 15, 2020
- October 8, 2020
- October 1, 2020
- September 24, 2020
- September 17, 2020
- August 27, 2020
- August 20, 2020
- August 7, 2020
- July 30, 2020
- July 23, 2020
- July 16, 2020
- July 10, 2020
- June 25, 2020
- June 18, 2020
- June 5, 2020
- May 14, 2020
- May 7, 2020
- May 1, 2020
- April 23, 2020
- April 2, 2020
- March 19, 2020
- March 5, 2020
- February 27, 2020
- February 20, 2020
- February 13, 2020
- February 6, 2020
- January 30, 2020
- January 23, 2020
- January 16, 2020
- January 9, 2020
See older releases
December 10, 2020
Product updates
Google Analytics 4 connector out of Labs
The GA4 connector is now in general availability.
In addition, you can now visualize your custom dimensions and metrics, and custom user properties in Data Studio.
More fields in the Display & Video 360 connector
DV360 data sources now provide the following fields:
- Line Item Type
- Inventory Source Type
- Creative Type
- CM Post-View Revenue
- Inventory Delivery Method
- Insertion Order Status
- Line Item Status
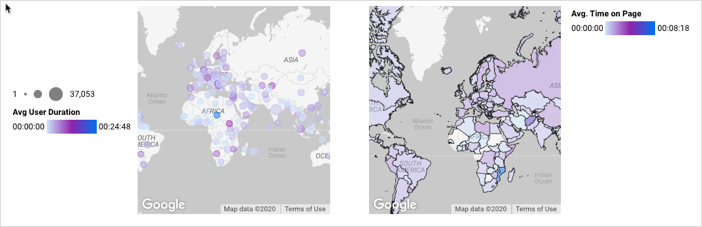
Improved Google Maps legend position
You can now position the Google Maps legend on the left or right of the chart. If your map uses both size and color legends, both legends must be on the same side.
Deprecating YouTube analytics watch time dimensions postponed
The deprecation of the old watch time dimensions in the YouTube Analytics connector will occur in January 2021.
December 3, 2020
Product updates
Removing deprecated YouTube watch time fields
On November 12, 2020, we announced the availability of new Average Watch Time and Total Watch Time metrics in the YouTube connector. Starting the week of Dec 7, the old watch time dimensions will be removed from new data sources you create using the YouTube Analytics connector, and also from existing YouTube data sources that you refresh.
Create reference lines based on total metric value
You can now add a reference line to your charts based on the total value of a metric rather than an aggregation of the values in the chart. For example, if a chart plots Bounce Rate for each browser, you can plot the overall bounce rate rather than the average of the bounce rates for the various browsers. Learn more
November 19, 2020
Product updates
Improved management for enterprise Terms of Service
Google Workspace and Cloud Identity administrators can now accept Data Studio’s enterprise Terms of Service on behalf of their organization. Once they do, they can manage data protection contacts centrally, and users in their organization don’t have to agree to the Terms of Service individually.
HIPAA compliance with Data Studio
Customers who are subject to the Health Insurance Portability and Accountability Act (HIPAA) and want to use Data Studio to process Protected Health Information (PHI) can now accept a Business Associate Addendum.
To access both the Terms of Service and HIPAA Business Associate Addendum:
- Sign in to Data Studio.
- At the top right, click Settings
.
Parameter-based reference lines
You can now create reference lines in your charts that get their value from a parameter. For example, you can bind a parameter to an input box control to let users input a sales target and then see that target represented as a reference line on a chart. Learn more
Search Console search type parameter
You can now configure the default search type in the Search Console connector. Select from Web, Image, or Video search. Learn more
November 12, 2020
Product updates
Color scale conditional formatting on pivot tables
You can now apply color scale conditional formatting to pivot tables. Learn more
Updated YouTube metrics
The YouTube connector now provides Average Watch Time and Total Watch Time metrics. (Previously, this data was available in unaggregated numeric dimensions. These fields have been deprecated but will continue to work as before.)
To use the new metrics in existing data sources, refresh the fields.
Improved field editing in reports
It's now easier to edit data source calculated fields and parameters. While editing your report, hover over the field in the Available fields list and click the Fx or @ icon. You can then edit that field in the data source.
November 5, 2020
Product updates
Campaign Manager is now Campaign Manager 360
We've renamed Campaign Manager to Campaign Manager 360. You'll see the updated name in both Data Studio and the Help Center. Learn more.
More fields from Google Analytics 4
The following fields are now available in Google Analytics 4 data sources:
- Average purchase revenue
- Purchase revenue
- Total ad revenue
- Total revenue
- Transactions
- Audience ID
- Audience name
- Operating system with version
- Signed in with user ID
- ARPU
- Operating system
- OS version
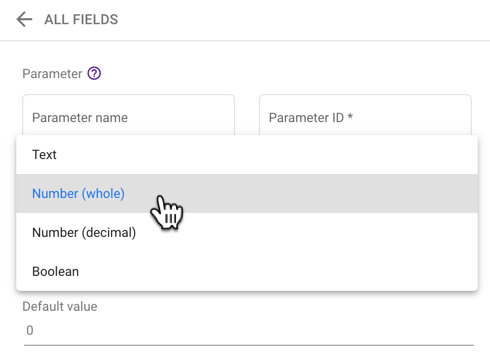
Integer parameter type
You can now specify that a numeric parameter accept only whole numbers (integer) or allow decimal numbers (floating point). This helps with use cases, such as certain database queries, that require integer values.
October 29, 2020
Product updates
Google Maps legend
Help your viewers better understand the data in your Google Maps by adding a legend. To configure the legend, edit the map's Style properties. Learn more.
October 15, 2020
Product updates
Improved community visualization management
We've simplified adding community visualizations to a report. Newly created data sources have community visualizations access turned on by default. When you add a community visualization to a report for the first time, you must grant consent to allow the chart to show your data. Learn more.
Documentation updates
Announcing Google Analytics 4 properties
Google Analytics 4 (GA4) is a new, more intelligent Google Analytics that builds on the foundation of the App + Web property we introduced last year. Read the announcement here.
Content in the Data Studio Help Center that covers Google Analytics features may distinguish "Universal Analytics" properties from "Google Analytics 4" properties. Universal Analytics refers to the previous generation of Analytics. This was the default property type for websites prior to October 14, 2020. Content that covers features supported in both property types continues to use "Google Analytics."
Developer interview videos
Data Vis Dev Talks are conversations with Data Studio developers and power users. Watch now.
October 8, 2020
Product updates
Compound conditional formatting in pivot tables
You can now create conditional formatting rules with multiple clauses using OR and AND logic in pivot tables. Learn more.
October 1, 2020
Product updates
Conditional formatting Date and Date & Time
You can now add conditional formatting rules to charts based on the new Date and Date & Time fields.
Bug fix: compare metrics in conditional formatting rules for pivot tables
We've fixed a bug that prevented you from building conditional formatting rules comparing one metric to another.
September 24, 2020
Product updates
"Missing data" support in pivot tables
You can now control how missing data in your pivot tables appear. Similar to standard tables, when data is missing from the pivot table, you can choose to show blanks, hyphens, or the words "no data."
September 17, 2020
Product updates
New and improved date and time functions
You now have greater control when working with dates and times. Use new and improved date and time functions in calculated fields to create and format dates and times, get the current date and time, perform date math, extract date parts, convert text to dates, and more.
To support these new and improved functions, we've introduced new Date and Date & Time data types. New data sources you create with datetime data use these new types.
No action required
Your existing date fields and formulas that use them continue to work as before. Your existing date fields appear as "compatibility mode" types in the data source. (Hint: if the date field type includes both the type and format (for example, Date (YYYYMMDD)), then it is a compatibility mode date. The new Date and Date & Time types only show the type.)
Upgrade compatibility mode dates to use the new functions. To use the new functions with your existing data source fields, you can upgrade them to new data types.
Date and time functions you can use:
| Create a date | |
| DATE(year, month, day) | Creates a date. |
| DATETIME(year, month, day, hour, minute, second) | Creates a date with time. |
| Get the current date | |
| CURRENT_DATE() TODAY() | Returns the current date as of the specified or default timezone. |
| CURRENT_DATETIME() | Returns the current date and time as of the specified or default timezone. |
| Add and subtract dates | |
DATETIME_ADD(datetime_expression, INTERVAL integer part) |
Adds a specified time interval to a date. |
DATETIME_SUB(datetime_expression, INTERVAL integer part) |
Subtracts a specified time interval from a date. |
| Calculate the difference between dates | |
| DATETIME_DIFF(date_expression, date_expression, part) | Returns the number of part boundaries between two dates. |
| Extract date parts | |
EXTRACT(part FROM date_expression) |
Returns part of a date. |
| YEAR(date_expression) | Returns the year of a given date. |
| QUARTER(date_expression) | Returns the quarter of the year for a given date. |
| MONTH(date_expression) | Returns the month of the year for a given date. |
| WEEK(date_expression) | Returns the week number for a given date. |
| DAY(date_expression) | Returns the day of the month on which the specified date falls. |
| YEARWEEK(date_expression) | Returns the year and week number of a given date. |
| WEEKDAY(date_expression) | Returns a number representing the day of the week for a given date. |
| Convert to dates and time | |
CAST(field_expression AS type) |
Converts a field or expression from one type to another type. |
| PARSE_DATE(format_string, text) | Converts text to a date. |
| PARSE_DATETIME(format_string, text) | Converts text to a date with time. |
| Format dates and times | |
| FORMAT_DATETIME(format_string, datetime_expression) | Converts a date to formatted text. |
| Truncate a date | |
| DATETIME_TRUNC(date_expression, part) | Truncates a date to the specified granularity. |
| Work with Unix dates | |
| DATE_FROM_UNIX_DATE(integer_expression) | Interprets an integer as the number of days since 1970-01-01. |
| UNIX_DATE(date_expression) | Returns the number of days since 1970-01-01. |
Visualize App + Web data in Data Studio
You can now add data from App + Web to your Data Studio reports and dashboards. You can visualize the fields available in the Google Analytics App+Web reporting API. This API are currently in trusted tester beta (to become a trusted tester, sign up here).
Connecting to App + Web properties is a Labs feature. Learn more.
August 27, 2020
Product updates
Embedded data sources make it easier to copy, share, and collaborate on your reports
New data sources you create while editing a report are now embedded in the report. When you share or copy the report, other report editors can now also edit the data source. You can still create separate, reusable data sources, as always.
Visualize your data using filled areas in Google Maps
You can now choose between 2 types of Google Maps: bubble maps and filled maps. Filled maps show your data as shaded polygons.
Creative asset fields in Google Ads
The Google Ads connector now includes the following ad creative asset-related fields:
- Final mobile URLs
- Final URLs
- Final URL suffix
- Ad type
- Ad strength
- Ad ID
- Asset ID
- Asset type
- Asset performance
- Asset policy approval status
Conditional formatting in pivot tables
You can now make your pivot tables more meaningful by adding single color conditional formatting rules. Create rules based on row, column, metric, or any value in the table.
Simplified CASE expressions
You can create simpler, easier to read CASE expressions in calculated fields by declaring the field to test once, then writing the matching values.
For example, instead of this:
CASE

  WHEN field=value1 THEN result1

  WHEN field=value2 THEN result2

  WHEN field=value3 THEN result3

  END
You can write this:
CASE field

  WHEN value1 THEN result1

  WHEN value2 THEN result2

  WHEN value3 THEN result3

  END
Link style settings in themes
August 20, 2020
Product updates
Create more dynamic reports using improved controls and parameters
You can now add new and improved controls to your reports. All the controls are available under the new Add a control menu:
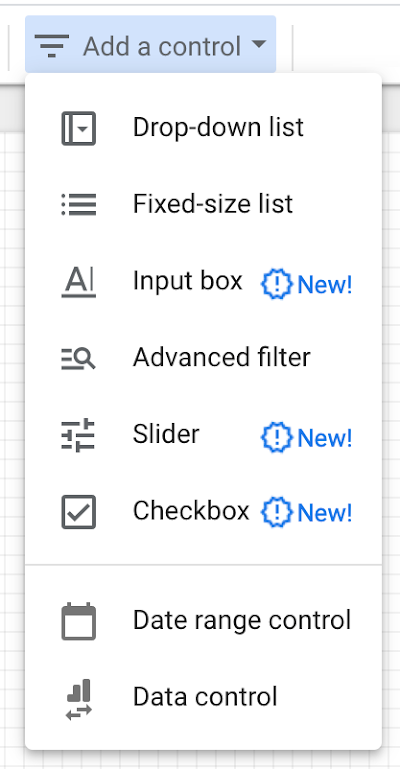
In addition to filtering your data, controls can also pass their values to calculated fields and connectors. This lets you create more dynamic reports that can respond to user input. For example, you can construct forecast models that let the viewer enter different values to see how your data responds in different scenarios. Parameter values can also be set in the report URL, which makes it easier to configure reports programmatically.
Learn more about controls and parameters.
Connect to Google Surveys
You can now use Data Studio to see your Google Surveys performance. The Surveys connector lets you visualize your survey questions and responses, filter by demographics such as Age, Gender, and Country, and include response weight metrics.
Data Studio API general availability
The Data Studio API is now generally available. Developers can use the API to search for Data Studio assets accessible to users in their domain and manage permissions at scale.
15 minute data freshness for BigQuery data sources
You can now automatically update your BigQuery data every 15 minutes.
Note: More frequent updates can give you fresher data, but may also slow performance and increase query costs.
Advertising channel subtype in Google Ads connector
You can now include the Advertising channel subtype field in your Google Ads charts.
August 7, 2020
Product updates
Ad group ID in Google Ads connector
You can now include the Ad group ID field in your Google Ads charts.
July 30, 2020
Product updates
Drive migration completed
July 23, 2020
Product updates
Transfer Data Studio assets to other users in your organization
G Suite administrators can now transfer Data Studio assets from one user to another. This makes it easier to transition projects when users leave your organization. Learn more (opens in the G Suite Admin Help Center).
Improved component selection
It's now easier to work with multiple components at once. Report editors can select components on the page by type (e.g. Tables on page, Scorecards on page, Controls on page) or by shared data source (e.g. All components with the same data source). Use the context ("right click") menu, then choose Select to see the available options.
|
Select menu from a chart. |
Select menu from the canvas. |


Improved custom color picker
You'll see a new and improved color picker in the report editor when creating custom component and data colors.

July 16, 2020
Product updates
New Google Ads fields
You'll now see the following fields in new or refreshed Google Ads data sources:
- Position above rate
- Keyword Text (Criterion)
New sample data sources
Sample Google Analytics and Google Ads data sources are being updated so they can use new fields launched in the past year. These data sources are used by several of the sample reports in the Data Studio Template Gallery.
If you've made copies of these sample reports and wish to keep using them, we recommend you replace the old data sources with these updated data sources, when they are available.
A new version of the [Sample] Google Analytics data source is now available here.
The [Sample] Google Ads data source will be updated the week of July 20th, 2020. In addition to new Google Ads fields, 2 obsolete fields have been removed: Avg. Position for Auction and Avg. position. Charts that use these fields will display a configuration error, which you can fix by editing the report, selecting any broken charts, and removing or replacing the obsolete fields.
July 10, 2020
Documentation updates
Improve Data Studio performance
Added tips for making faster loading reports and more responsive charts. Go to the article.
June 25, 2020
Product updates
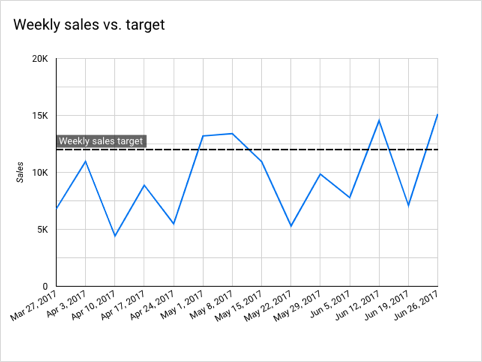
Add reference lines to charts
Highlight values of interest in your charts and visualize progress towards your goals by adding reference lines.
For example, you can use reference lines to visualize daily sales against a target sales figure, or show the average revenue per store and compare each store to that average. Learn more.
More data from the Display & Video 360 connector
You now have access to more fields in your Display & Video 360 data sources:
Dimensions
- Inventory Source
- Environment
- Targeted Data Providers
Metrics
- Active View: Impression Distribution (Not Measurable)
- Active View: Impression Distribution (Not Viewable)
- Active View: Impression Distribution (Viewable)
- Active View: Eligible Impressions
- Active View: Measurable Impressions
- Active View: Audible & Fully On-Screen for Half of Duration (15 sec. cap) Rate
- Active View: % Measurable Impressions
- Active View: % Viewable Impressions
- Active View: Not Measurable Impressions
- Active View: Not Viewable Impressions
- Active View: Impressions Visible 10 Seconds
- Data Fees (Advertiser Currency)
- CM Post-Click Revenue
- Platform Fee (Advertiser Currency)
Documentation updates
Filter by multiple email addresses per row
Added a solutions article showing how to use data blending to create many-to-many email filters. Learn more.
June 18, 2020
Product updates
Filter charts by metric values
You can now add a metric slider control to your charts. Report viewers can use this to filter a chart by metric value. For example, you can limit the chart to only show Average Orders where the total value is between $100 and $200, or where Levels Completed (in a game) is less than 5. Learn more.
Improved data source switching
We've improved how Data Studio handles replacing a data source in your reports. When you switch a data source in your report, Data Studio tries to map the fields in the old data source to the fields in the new data source based on a number of matching criteria, including field ID, field name, and other configuration information from the report itself. Learn more.
June 5, 2020
Product updates
Drive migration for G Suite users
Data Studio is moving off of Google Drive. This migration is complete for non-G Suite users. G Suite users will be migrated in the coming weeks. You don't need to take any action but G Suite administrators can learn more here.Set sharing permissions for users
As a G Suite or Cloud Identity administrator, you can control how users in your organization share Data Studio assets. This helps ensure that Data Studio usage is secure and complies with your organization's policies. Sharing permissions are being enforced now for Cloud Identity users, and will be enforced for G Suite users after migration. Learn more.
May 14, 2020
Product updates
Data Studio API Developer Preview
The Data Studio API is now available for Developer Preview. Developers can use the API to search for Data Studio assets accessible to users in their domain and manage permissions at scale. Learn more about the Data Studio API Developer Preview.
May 7, 2020
Product updates
Use drag and drop fields to create and append to charts
You can now create charts automatically by dragging a field from the Available fields panel onto the report canvas:
- Drop a text or number dimension on the canvas to create a table
- Drop a date dimension to create a time series.
- Drop a geographic dimension to create a Geo chart.
- Drop a metric on the canvas to create a scorecard.
You can also add dimensions and metrics to charts by dragging and dropping fields directly onto the chart.
May 1, 2020
Product updates
Google Maps in Data Studio
Adding Google Maps to your reports gives your viewers a familiar interactive environment in which to explore geographic data. Google Maps in Data Studio are highly customizable and integrate with any data source that contains valid geo fields. Learn more.
Google Analytics integration
You can view Google Analytics audiences, acquisition, and behavior data directly from within the Analytics interface with a single click.
Google marketing report templates
Use these report templates to help answer some of the most common questions marketers have about their Google marketing data. See the templates here.
Documentation updates
Geo dimension reference
Added a new article to better document the supported geographic fields used by Google Maps and Geo charts.
April 23, 2020
Product updates
Conditional formatting for drill down and optional fields
You can now apply conditional formatting rules to drill down dimensions and optional metrics. However, the rules only take effect when those fields are visible in the chart or table. Learn more about conditional formatting.
Improved management of community visualization resources
You can now remove community visualization resources using the Resource > Manage visualization resources menu. Learn more about community visualizations.
April 2, 2020
Product updates
New Display & Video 360 fields
You can now report on the following fields via the Display & Video 360 connector:
- App/URL
- App/URL ID
- Device Type
- Exchange
- Exchange ID
See these fields in action in the Display & Video 360 Performance Dashboard template.
Documentation updates
Updated the Calculated fields tutorial.
March 19, 2020
Product updates
Color scale conditional formatting
You can now apply conditional formatting using a color scale. This lets you add colors to your charts that correspond to minimum, midpoint, and maximum thresholds. Learn more.
New add data workflow
It's now faster and easier to add data to your reports. You'll notice a more streamlined experience when creating a new report. And there is a new Add data button in the report editor. You can see the new flow in this tutorial.
Customize scheduled email subject line and message body
You can now edit the subject line and add a custom message to scheduled emails. In addition, scheduled emails will now show the sender's address "via Google Data Studio."
New Ads connector fields
The Google Ads connector now provides better support for Auction Insights and App Install campaigns by providing the following fields:
- Shopping impression share
- Shopping outranking share
- Shopping overlap rate
- Store display name
- Installs
- Cost / install
- In-app actions
- Cost / in-app actions
March 5, 2020
Product updates
Local campaign fields in Ads connector
You can now add the following Local campaigns fields to your reports:
- Store location address line 1
- Store location address line 2
- Store location business name
- Store location city
- Store location country code
- Store location phone number
- Store location postal code
- Store location province
- Call clicks
- Driving directions
- Menu
- Orders
- Other engagements
- Store visits
- Website visits
- Call clicks (view-through)
- Driving directions (view-through)
- Menu (view-through)
- Orders (view-through)
- Other engagements (view-through)
- Store visits (view-through)
- Website visits (view-through)
- Local reach (impressions)
- Affiliate store location address line 1
- Affiliate store location address line 2
- Affiliate store location business name
- Affiliate store location city
- Affiliate store location country code
- Affiliate store location phone number
- Affiliate store location postal code
- Affiliate store location province
Date & time picker in report filters
You'll now see the calendar widget when creating filters based on date and time fields.
February 27, 2020
Product updates
Multiple preview images in report email
Scheduled emails now include a preview image for up to 5 pages of the attached report. If you've selected more than 5 pages, the email displays the first 5, along with a note that additional pages are available in the attached PDF file.
February 20, 2020
Product updates
Select scheduled email pages
You can now select which pages of your report to include in the email. Learn more.
February 13, 2020
Product updates
Filter by the signed-in user's email address
You can now filter a data source to show just the records containing the current signed-in viewer's email address. This provides "row-level security" to the data. Note that your data must contain an email field, and that viewers must consent to allowing Data Studio to pass their email address to the data source.
Improved support for multiple accounts
Do you sign into multiple Google accounts at once? The new account switcher lets you select one of your other signed-in accounts should you try to access a Data Studio asset created by or shared with an account other than your primary account. Your primary account is the first one you signed into in your browser.
Note that you may also see this page if the report or data source you're trying to access doesn't exist.
Support for Hotel campaigns in Google Ads
You can now see your Hotel ads campaign data in Data Studio reports. This data automatically appears in your Ads-connected reports. There is no need to refresh the data source.
February 6, 2020
Product updates
Additional fields in Ads data
Google Ads data sources now include App, Local, and Smart campaign data. Use the Advertising channel type field to see the campaign type. This data is automatically available in new data sources. To add these to existing data sources, just refresh the data source fields.
January 30, 2020
Product updates
Return NULL from CASE
CASE statements can now return the NULL literal from THEN and ELSE clauses. Learn more.
January 23, 2020
Product updates
Smart guides in the report editor
The report editor now offers smart guides to help you align, resize, and space components on the canvas. This can help make creating attractive, well-crafted reports even easier. Learn more.
Extract a report theme from an image
You can now automatically generate a custom theme for your reports based on the colors in an image. This makes it easy to coordinate the text and data colors with an image in your report, such as a logo or product photo. You can also create themes from images you upload or can access on the web. Learn more.
January 16, 2020
Product updates
Additional fields in Search Ads 360 data
The Search Ads 360 connector now provides additional fields to help you visualize your impression metrics:
- Impr (abs top) %
- Impr share (abs top) %
- Impr (top) %
- Impr share (top) %
- Lost abs top IS (budget)
- Lost abs top IS (rank)
- Lost top IS (budget)
- Lost top IS (rank)
You can learn more about these fields in the Search Ads 360 Help Center.
Add community visualizations from the Community Gallery to your reports
You can now add data visualizations built by the Data Studio developer community by selecting them from the Community Gallery. Learn more.
January 9, 2020
Product updates
Custom email schedules
You can now email your reports via a custom schedule. For example, you can send the report every Tuesday and Thursday, or every 2 weeks on Friday. Learn more about scheduled email delivery.
Additional data freshness options for *SQL and Cloud* connectors
You can now refresh the data every hour, every 4 hours, or every 12 hours for data sources based on the following connectors:
- Cloud SQL
- MySQL
- PostgreSQL
- Cloud Spanner
- Cloud Storage
Learn more about database connectors.