Goals
In this tutorial, you'll accomplish the following:
- Learn how to create a simple arithmetic calculated field.
- Create a conditional expression to evaluate your data and return different results.
- Learn different approaches to implementing calculated fields.
Scenario
Suppose you manage an online pet supply store. You might measure sales data, such product codes (SKU), item names, price, and quantity sold. Here's a simple example:
| SKU | Item | Price | Qty Sold |
| D-001 | Healthy Dog Dog Food |
79.96 |
16 |
| B-002 | Parrot Perch |
74.97 |
8 |
| B-001 | Pretty Bird Bird Seed |
31.96 |
20 |
| C-002 | Hungry Kitty Cat Food |
29.98 |
3 |
| D-002 | Playful Puppy Toy |
17.97 |
11 |
| C-001 |
Happy Cat Catnip |
14.97 |
4 |
Calculated fields in Looker Studio can help you manipulate and extend this data. In this exercise, you'll use calculated fields to perform these tasks:
- Calculate the total value of each order.
- Apply a discount to orders over a certain amount.
- Categorize sales into departments.
A note on the solutions
There can often be more than one way to achieve a particular result with calculated fields, depending on your needs and how you want to use those fields. This tutorial walks you through one approach (using separate fields for the calculations). At the end of this article, you'll find some alternative solutions.
Sample data
To complete this exercise as written, use the following sample data. Otherwise, use your own data (adjusting the field names accordingly). You'll need access to Google Sheets. Alternatively, you could use the File Upload connector to import the data into Looker Studio.
SKU,Item,Price,Qty Sold

    D-001,Healthy Dog Dog Food,79.96,16

    B-002,Parrot Perch,74.97,8

    B-001,Pretty Bird Bird Seed,31.96,20

    C-002,Hungry Kitty Cat Food,29.98,3

    D-002,Playful Puppy Toy,17.97,11

    C-001,Happy Cat Catnip,14.97,4
Prepare the data
- Copy the sample data in the previous box.
- Open a text editor, paste in the sample data, and save the file as
pet-store-data.csv.-
Be sure to save this file as plain text; otherwise, Sheets won't be able to import the data.
-
On Windows, you can use Notepad.
-
On macOS, you can use TextEdit and then select Format > Make plain text.
-
On Chrome OS, you can use the Text app or Google Docs and then select File > Download and choose Plain Text.
-
-
- Create a new Google Sheet.
- In Sheets, select File
Import.
- Select Upload and then upload the sample data file you created in step 2.
- Select Replace spreadsheet.
-
Name your spreadsheet
Pet Store.
 Create a report and add the data
- Create a new report in Looker Studio.
- In the Add data to report panel, select the Google Sheets connector.
- Select the
Pet Storespreadsheet and worksheet you just created. - Leave the default options selected.
- Click ADD.
In a moment, you'll see the new report, with a table on the canvas that uses fields from the Pet Store data source.
Pet Store spreadsheet in the list, try reloading Looker Studio. Create the subtotal field
- In the menu, select Resource > Manage added data sources.
- Locate the Pet Store data source and then click
EDIT.
The data source fields panel appears. - Click
ADD A FIELD.
The calculated field editor appears. - In Field Name, enter
Subtotal. - In Formula, enter
Price * Qty Sold.Tip: The formula editor autocompletes dimension, metric, or function names as you type. You can also drag fields from the Available Fields list into your formula. - Click SAVE.
- Return to the main data source editor by clicking ALL FIELDS.
 Create the discount field
Let's say you want to give different discount rates depending on the value of the order. Create another calculated field, called Discount, that evaluates the Subtotal field and applies the following discounts.
| Subtotal value | Discount rate |
| 0 - 99 | 0 |
| 100 - 499 |
5% |
| 500 or more | 10% |
Hints:
- In this step, you'll only calculate the discount. You'll apply it in the following step by multiplying the Subtotal field by the Discount field.
- Use the CASE expression to evaluate the Subtotal field.
- Use a WHEN clause for each discount rate.
- Use an ELSE clause to return the full price (0% discount).
- Express the discount as a decimal value. For example, a 25% discount would be .25.
Solution
CASE

       WHEN Subtotal > 499 THEN .9

       WHEN Subtotal > 100 THEN .95

      ELSE 1

      END
Note: WHEN clauses are evaluated in order, and the first one that is true is the one whose THEN clause is returned.
 Create the total field
Create another calculated field, called Total, that multiples the Subtotal field by the Discount field.
Solution
Subtotal * Discount Create the department field
Create a final calculated field, called Department, that parses the SKU field and assigns new values depending on the SKU. You'll group dog, cat, and bird related items into separate departments.
Hint: Use the CASE statement again, this time with the STARTS_WITH (or REGEXP_MATCH) function.
Solution
CASE

        WHEN STARTS_WITH(SKU, "C") THEN "Cat"

         WHEN STARTS_WITH(SKU, "D") THEN "Dog"

         WHEN STARTS_WITH(SKU, "B") THEN "Bird"

         ELSE "Misc"

        END
See your data in a report
- After saving the Department field, on the left, return to the data source editor by clicking ALL FIELDS.
- Click DONE and then close the manage data sources panel.
You can now add your new calculated fields to charts by using these steps:
- Select the table.
- Add each calculated field you created to the table by dragging them from the Data panel onto the table or into the table's Setup panel.
Alternative solutions
The previous solution breaks the problem up into individual chunks and creates discrete fields to handle each chunk, as you've done with the Subtotal, Discount, and Total fields.
Another approach is to perform all the calculations in a single calculated field. For example, you could combine steps 3 - 5 of this tutorial into one field:
CASE

  WHEN Price * Qty Sold > 499 THEN (Price * Qty Sold) * .9

  WHEN Price * Qty Sold > 100 THEN (Price * Qty Sold) * .95

  ELSE Price * Qty Sold

  END
There are pros and cons to each approach:
Breaking down complex formulas into separate fields can make your formulas easier to read and write as well as less error-prone. Separate fields can also be useful in more contexts. For example, using a separate field for the discount rate lets you use that field in other calculations or display it in your reports. One drawback to creating formulas with lots of discrete calculated fields is that it may not be obvious what each one does, so you'll need to edit them individually to see how they are calculated.
On the other hand, centralizing all the logic into one field can make simple formulas easier to understand and edit. But you also might have to do a lot of repetitive typing, and a complex formula may be harder to extend or maintain. For example, say you had 10 product tiers with different order quantity thresholds. Or say you wanted to use the same discounts for a different product line. In these cases, it might be easier or more efficient to use separate fields for those thresholds and discounts.
The middle path
This solution blends the two approaches described previously. It keeps the main logic in a single field while breaking out some of the dependent logic into separate fields:
CASE

  WHEN Subtotal > Large Order THEN Subtotal * Large Order Discount

  WHEN Subtotal > Medium Order THEN Subtotal * Medium Order Discount

  ELSE Subtotal

  END
For this solution, we've created separate fields to hold values for large and medium orders and corresponding discounts.
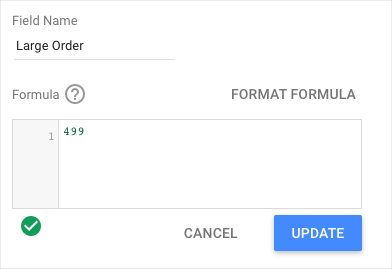

This solution has the advantage of being easy to read, flexible, and relatively easy to adjust as needed.