- December 16, 2021
- December 9, 2021
- December 2, 2021
- November 4, 2021
- October 21, 2021
- October 7, 2021
- September 30, 2021
- September 23, 2021
- September 16, 2021
- September 9, 2021
- August 19, 2021
- August 12, 2021
- August 5, 2021
- July 29, 2021
- July 22, 2021
- July 1, 2021
- June 24, 2021
- June 17, 2021
- June 10, 2021
- May 20, 2021
- May 13, 2021
- May 6, 2021
- April 29, 2021
- April 22, 2021
- April 15, 2021
- April 8, 2021
- April 1, 2021
- March 25, 2021
- March 18, 2021
- March 11, 2021
- March 4, 2021
- February 25, 2021
- February 18, 2021
- February 11, 2021
- February 4, 2021
- January 28, 2021
- January 7, 2021
See older releases
December 16, 2021
Product updates
More data from Google Ads
You can now visualize the following dimensions using the Ads connector:
- Account Budget Order Amount,
- Account Budget Order Adjustable Amount,
- Account Budget Amount Spent,
- Campaign Bid Strategy Type,
- Ad Group Bid Strategy,
- Target CPA,
- Target ROAS,
- User Ad Distance
- First Position Bid
To see these fields in your existing data sources, refresh the fields.
December 9, 2021
Product updates
View more data in tables
You can now visualize up to 100 dimensions and 100 metrics for tables based on "flexible schema" data sources, such as Sheets or BigQuery. (For data sources based on "fixed schema" connectors, such as Ads and Google Analytics, you can have 10 dimensions and 20 metrics.)
You can also now enable horizontal scrolling for tables:
- Edit your report and select the table.
- On the right, select the the STYLE tab, then under Table Body, check Horizontal scrolling.
Respect report theme for page navigation
You can now have page navigation in your reports match the selected report theme:
-
Edit your report.
-
In the toolbar, click Theme and layout.
-
On the right, select LAYOUT, then check Respect report theme.
-
View your report.
The page nav background and text colors will appear in a style that matches your theme.

December 2, 2021
Product updates
Visualize data from Amazon Redshift (beta)
You can now connect to Amazon Redshift and then visualize that data in your Data Studio reports and explorations. Note: this connector is currently in beta testing.
Learn more about the Amazon Redshift connector.
November 4, 2021
Product updates
Interact with your report in edit mode
You can now interact with your reports in edit mode in many of the same ways as you can in view mode. For example, you can apply a filter and adjust the date range without having to switch to view mode. This makes it faster and more convenient to get insights from your reports and analyze your data.
New data panel
Also, with this release, we've added a new Data panel to the report editor. You'll see this panel whenever nothing else on the report is selected.
You can use the data panel to switch between data sources and see all of the available fields for that data source. To create a new chart, just drag a field from the list to the canvas. If you drop a field on an existing chart, you'll add that field to the chart.
Watch a demo
More data from Display & Video 360
You can now visualize the following dimensions using the Display & Video 360 connector:
- Budget Segment Name
- Budget Segment Start Date
- Budget Segment End Date
- Budget Segment Pacing Percentage
- Budget Segment Budget
- Line Item Start Date
- Line Item End Date
- Line Item Budget
- Line Item Pacing Percentage
- Insertion Order Goal Type
- Insertion Order Goal Value
- Percentage from Current IO Goal
- Budget Type (Segment)
To see these fields in your existing data sources, refresh the fields.
Documentation updates
Now that you can interact with your reports in edit mode, you'll see fewer references to "viewers" and "editors" in the Help Center. Instead, when we say "you" or "people" we generally mean either viewers or editors. We'll still point out when something is only possible for report or data source editors.
We've refactored the About controls article. You'll now find information on specific controls in individual articles in Make reports interactive topic.
October 21, 2021
Product updates
Google Maps in embedded reports
You can now include Google Maps in embedded reports. When embedding is enabled, a Data Studio report supports up to 30,000 free Google Map loads per month. You can increase the number of map loads allowed by adding a Google Maps API key to the report.
Learn more about adding a Google Maps API key.
Visualize GA4 ecommerce fields
You can now access the following Google Analytics 4 ecommerce fields using the Google Analytics connector:
- Item brand
- Item category
- Item category 2
- Item category 3
- Item category 4
- Item category 5
- Item ID
- Item name
- Item list ID
- Item list name
- Item promotion creative name
- Item promotion ID
- Item promotion Name
- Order coupon
- Transaction ID
- Add-to-carts
- Checkouts
- Ecommerce purchases
- Item purchase quantity
- Item revenue
- Item list clicks
- Item list click through rate
- Item list views
- Item promotion clicks
- Item promotion click through rate
- Item promotion views
- Item views
- Cart-to-view rate
- Purchase-to-view rate
- Total purchasers
- First time purchasers
To see these fields in existing data sources, refresh the field list.
Visualize data from Microsoft SQL Server 2017 (beta)
You can now connect to Microsoft SQL Server 2017 and then visualize that data in your Data Studio reports and explorations. Note: this connector is currently in beta testing.
Learn more about the Microsoft SQL Server 2017 connector.
October 7, 2021
Product updates
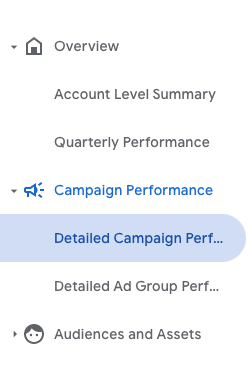
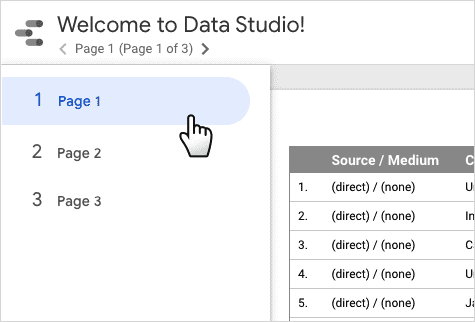
Improved page navigation
You can now create more organized reports by adding sections, headers, and icons to page navigation.
Learn more about adding, removing, and reordering pages.
September 30, 2021
Product updates
Visualize BigQuery GEOGRAPHY data as bubbles
You can now plot BigQuery GEOGRAPHY fields using a bubble layer in Google Maps without having to convert the data to latitude and longitude first (see that workaround below).

Prior to this feature release, if you had a GEOGRAPHY field that contains points and you wanted to visualize that data in Data Studio, you needed to use the following workaround. This is no longer necessary (just use your Geography field in the Geospatial setting of your Google Map). This workaround is simply preserved here for posterity:
- Return the coordinates in the format lat,lng (e.g., 47.4073238,-120.5757999). For example, if you have a GEOGRAPHY field point_geom_field, you can use the following SQL expression:
ST_Y(point_geom_field) || "," || ST_X(point_geom_field) - In Data Studio, set this field’s data type to Geo → Latitude, Longitude.
- Choose Bubble map and choose this field as the Location.
September 23, 2021
Product updates
Updated data source pickers
We've updated the styling of the data source pickers to be more intuitive and useful. It's now easier to distinguish the connector used by the data source, as well as easier to manage your data in the report via a link in the picker.
The new style applies to the data source pickers used by the copy report dialog, blend editor, extract data screen, and the filter editor. The data source pickers in the main properties panel will be updated in a future release.

September 16, 2021
Product updates
Single-table blend bug fix is live
We've fixed the single-table blending bug described below.
September 9, 2021
Product updates
Search for reports and data sources by owner name or email
It's now easier to find reports and data sources created by people you collaborate with. You can search for an owner’s name or email address on the Data Studio homepage to find assets that person has shared with you.
Single-table blend bug fix
We are fixing a bug that affects blended data sources based on a single table. The fix will be released next week, but because this may change the behavior of a small number of reports, we're announcing the fix in advance.
Before the fix:
Charts that use only a subset of the available fields from a blend based on a single table don't properly group dimensions or aggregate metrics, resulting in duplicate rows in the chart.
After the fix:
Charts that use only a subset of the available fields from a blend based on a single table will properly group and aggregate the data.
Note: This change doesn't impact charts using multi-table blends, or charts using all available fields of a single-table blend.
August 19, 2021
Product updates
Improved text functions
We've removed the limitation in several text functions that required you to use literal values for the starting and/or length parameters. Now, you can use fields and expressions to provide those parameters. The following functions have been updated:
For example, SUBSTR() previously required a literal number for the starting index and offset. Now, you can do things like:
SUBSTR(my_field, some_expression, LENGTH(another_field)-1)
New REGEXP_CONTAINS function in calculated fields
You can now use the REGEXP_CONTAINS function in calculated fields. This function returns true if a piece of text matches a regular expression. Learn more about REGEXP_CONTAINS.
August 12, 2021
Product updates
New gauge chart
Gauge charts give you a way to quickly see how well a given metric is performing against a target goal. Learn more about configuring a gauge chart.
August 5, 2021
Product updates
More report templates
Get started visualizing your data quickly with new marketing templates. To visit the report gallery:
- Sign in to Data Studio.
- On the left, click Templates.
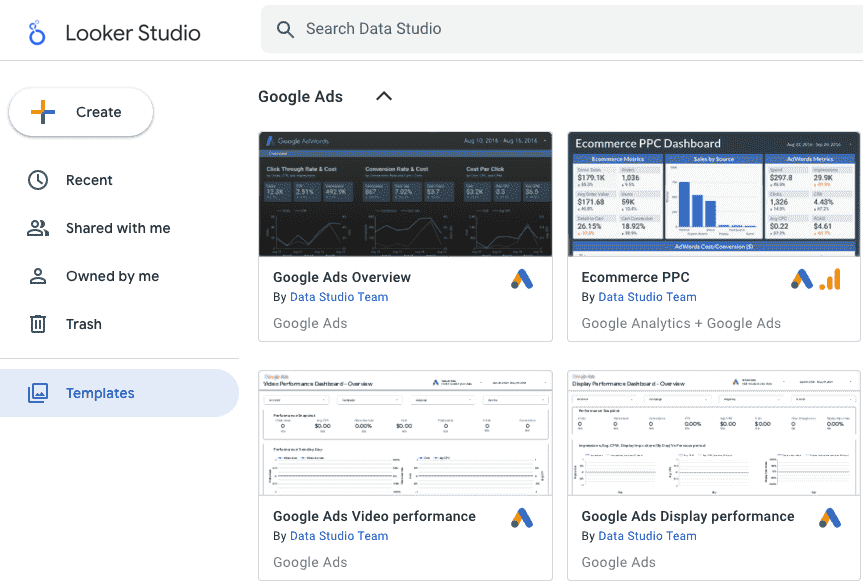
Be sure to expand each section to see all the available reports.
July 29, 2021
Product updates
Increased limits for Google Maps
You can now plot up to 100,000 Latitude and Longitude values in a Google Map (previously 10,000). For Latitude, Longitude, and BigQuery geospatial data, you can also increase the limit from 100,000 to 1 million. Note that the map may take longer to load if you increase the limits. Learn more.
July 22, 2021
Product updates
Updated page navigation
We've updated the styling of the "Drop down" page navigation option to be consistent with the other navigation styles. This option is now called "Top left" and looks like this:
July 1, 2021
Product updates
Support for Google Analytics 4
You can now use Google Analytics 4 (GA4) to gain insights about your Data Studio reports.
With Google Analytics 4 you can get automated insights and utilize Analytics' flexible Explorations feature to dig deeper into your data. Learn more.
June 24, 2021
Product updates
Google Maps 2nd-level country subdivisions
We've added a Country subdivsion (2nd level) field to the available Geo data types. You can use this to visualize US counties and other 2nd-level country subdivisions (for example, French departments, Italian provinces) in Google Maps. As part of this change, the Country subdivsion (1st level) field replaces Region.
In addition, we've simplified the Geo data types. Previously, we had separate fields for Continent and Continent Code, Country and Country Code, etc. We've combined these into single fields which accept either a name or a valid code. For example, Country accepts either a 2-letter or 3-letter ISO code ("AU" or "AUS" for Australia), a 3-digit country code ("036" for Australia), or you can specify a country by name ("Australia").
We've also combined the Metro and Metro Code fields into Designated market area. This accepts either a geographical targeting criteria ID or a DMA name.
Currency conversion support in Google Ads
You now have the option to convert multiple currencies in Google Ads manager accounts.
If you select All currencies, and choose accounts that use different currencies, Data Studio converts all revenue-related fields to the currency of the top level Google Ads manager (MCC) account. Learn more.
Visualize more data from Google Ad Manager
You can now access the following fields in Google Ad Manager data sources:
- Line item ID
- Order ID
- Creative ID
- Ad unit ID (top level)
- Placement ID
- Country ID
- City ID
- Master and Companion creative ID
- App ID
Preserve formatting in data export
You now have the option to preserve data formatting when exporting to CSV, Sheets, or Excel. Enabling the Keep value formatting option causes Data Studio to preserve the number and date formats applied in Data Studio to the exported data. For example, with this option turned on, numbers formatted as percent also appear as percentages in your CSV or spreadsheet data. Learn more.
June 17, 2021
Product updates
Enable or disable comparison date ranges in community visualizations
There is now a features section in the configuration file for community visualizations which allows developers of visualizations to enable or disable date range comparisons. The Data Studio Community Component (DSCC) library has also been updated to support date range information. Learn More.
Google Maps default zoom improvement
The map now auto-zooms to a smaller area around the plotted locations in some cases when it previously auto-zoomed to the entire world, such as when the plotted locations straddle the 180th meridian.
June 10, 2021
Product updates
Create calculated fields in blended data source tables
Report editors can now create calculated fields when configuring a blended data source. Learn more.
May 20, 2021
Product updates
Named versions
You can now manually create named versions of reports and data sources. This gives you more control over when versions are captured and allows you to integrate version control into your workflows.
In addition, you can now rename and delete existing versions from the version history panel. Learn more.
May 13, 2021
Product updates
Return non-numeric literals in aggregated CASE statements
You can now use non-numeric (e.g., text, date) literals in CASE statements based on aggregated WHEN clauses. For example:
WHEN AVG(satisfaction) >= 4 THEN "Good"
WHEN AVG(satisfaction) >= 3 THEN "Fair"
WHEN AVG(satisfaction) < 3 THEN "Poor"
END
(Previously this returned an error.)
This update also fixes an issue where calculated fields that pass metrics and aggregate expressions into text functions were incorrectly detected as dimensions. With the fix, they're correctly detected as metrics.
Manually enter dataset and table names in BigQuery connector
You can now type in the dataset and table names when connecting to BigQuery. These entry fields appear when there are too many tables or datasets to display in the list.
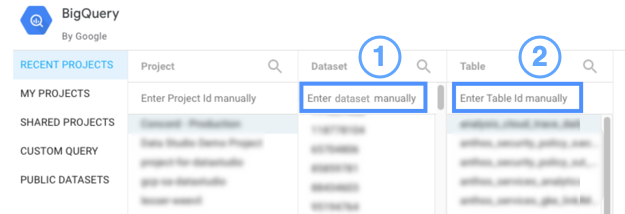
- Enter dataset manually.
- Enter table ID manually.
Documentation updates
We've added supported versions and limitations information to the following articles:
May 6, 2021
Product updates
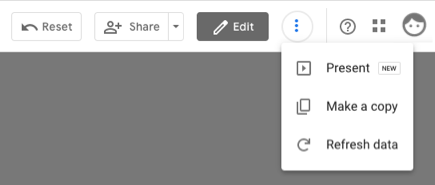
Display a report in full screen and cycle through pages automatically
You can now display a report as a presentation, similar to Google Slides. You can show the presentation full screen, and choose to automatically display each page the report for a specified amount of time.
To present a report:
- View the report you want to present.
- In the upper right, click More options
.
- Click
Present.
More streamlined toolbar
Documentation updates
We've updated the calculated fields tutorial to include the improved functionality in CASE statements announced on March 11.
April 29, 2021
Product updates
MySQL 8 support
You can now visualize data from MySQL 8 using Data Studio.
April 22, 2021
Product updates
Get notified if your scheduled email doesn't send
You'll now receive an email if your scheduled email report fails to go out.
JDBC connector improvements
We've made several improvements to JDBC-based connectors (Google Cloud SQL for MySQL, MySQL, and PostgreSQL). In particular, we've fixed a bug that prevented COUNT_DISTINCT from working properly.
Page path dimensions in Google Analytics 4
You can now visualize the following GA4 dimensions using the Google Analytics connector:
- Page path + query string
- Full page URL
April 15, 2021
Product updates
Reset report filters and selections
Report viewers can now use the new Reset button to reset all filters and selections they've made. This restores the report to its default view state.
Use community visualizations in embedded reports
You can now use community visualizations in an embedded report.
April 8, 2021
Product updates
Better BigQuery SQL parameters
You can now use any parameter in a BigQuery custom SQL query, regardless of where you created the parameter. (Previously, you could use only those parameters you created on the custom SQL query page.)
Also, you can now define a range of permitted values, allowing you to bind a Slider control to these parameters.
April 1, 2021
Product updates
New conditional functions
You can now use 3 new conditional functions in calculated fields:
- COALESCE. Returns the first non-missing value found in a list of fields.
- IFNULL. Returns a result if the input is null, otherwise, returns the input.
- NULLIF. Returns null if the input matches an expression, otherwise returns the input.
BigQuery GEOGRAPHY support
You can now visualize polygons from a BigQuery GEOGRAPHY field on a Google Maps visualization. Want to try it out? Take this quick tutorial.
March 25, 2021
Product updates
Event-scoped campaign dimensions in Google Analytics 4
You can now visualize the following GA4 dimensions using the Google Analytics connector:
- Campaign ID
- Campaign
- Google Ads account name
- Google Ads ad group ID
- Google Ads ad group name
- Google Ads ad network type
- Medium
- Source
- Traffic origin
Improved text functions in PostgreSQL
We've fixed a bug that prevented the CONTAINS_TEXT, STARTS_WITH, ENDS_WITH, and REGEXP_MATCH functions from working correctly with the PostgreSQL connector.
March 18, 2021
Product updates
Report publishing
You can now control when viewers see the changes you make to a report. By default, viewers see changes in real-time. Report publishing lets editors make changes to a draft version of the report, and then publish the draft when it's ready to go. Learn more.
March 11, 2021
Product updates
Simpler and more powerful conditional expressions
Conditional expressions evaluate some input and return a result when that input meets a condition you specify. Data Studio now gives you 3 ways of writing conditional expressions in calculated fields:
- Searched CASE
- Simple CASE
- IF() NEW!
IF function
The new IF function lets you create simple "if / then / else" statements. For example:
IF(Actual Sales > Forecast Sales, Bonus * 1.2, Bonus)Use parameters and functions and do math in conditional expressions
You can now include any valid expression in CASE expressions and the IF() function. For example:
CASE WHEN AVG(NumericDimension) > .75 THEN AnotherMetric * 2 ELSE YetAnotherMetric / 3 ENDYou can also now directly reference a parameter in a conditional expression:
IF(MyParameter="some value", ThisDimension, ThatDimension)Raw string literal
You can now use the "raw string literal" R in quoted strings. This can simplify writing formulas, such as regular expressions, that require special characters to be "escaped." For example, a raw quoted string uses a single backslash to escape metacharacters in regex, making it easier to read:
With the Raw string literal prefix:
REGEXP_REPLACE(String, R"(\[.*\])\+(\[.*\])",R"\2 \1")
Without the Raw string literal:
REGEXP_REPLACE(String, "(\\[.*\\])\\+(\\[.*\\])","\\2 \\1")
Deprecating YouTube analytics watch time dimensions completed
As announced last year, we've deprecated the old watch time dimensions in the YouTube Analytics connector. You should now use the new Average Watch Time and Total Watch Time metrics instead.
Documentation updates
We've updated and improved the documentation of conditional expressions, regular expressions, and calculated fields in general:
New articles
Updated articles
March 4, 2021
Product updates
Recent projects tab in BigQuery connector
It's now easier to connect to your BigQuery projects. The new Recent projects tab shows you up to 50 projects you've accessed recently in the GCP Cloud Console.

February 25, 2021
Product updates
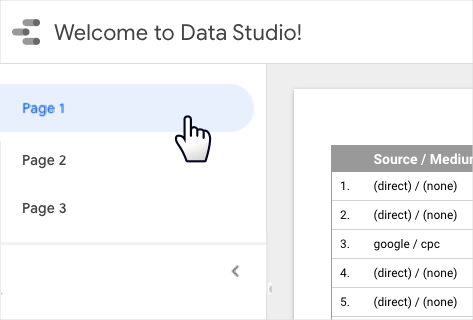
New page navigation styles
You now have more control over the look and positioning of the page navigation in your reports. Choose between 4 styles:
Left
Pages appear in a collapsible drawer in the left margin of your report.
Tab
Pages appear as tabbed links at the top of the report.

Dropdown
Pages appear in a drop-down menu above the report.
Hidden
No page navigation is displayed.
Chart data label compact numbers and decimal precision
You can now use compact numbers and set decimal precision for data labels in time series, bar, line/combo, and area charts. Note that these settings apply to the data labels in your charts. Tooltips ("hover cards") show the full metric value.
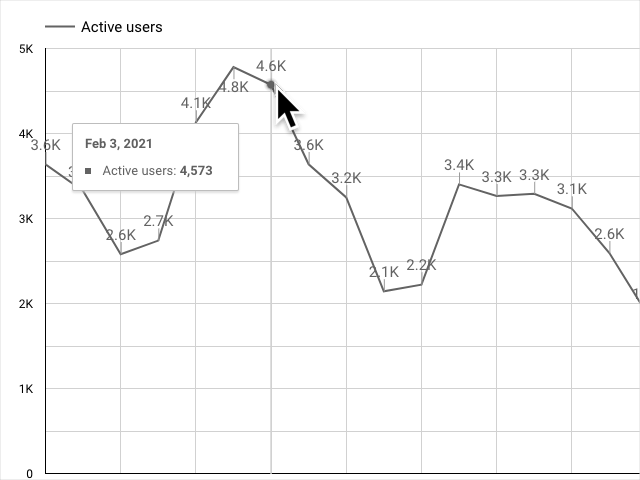
Learn more in the chart references.
February 18, 2021
Product updates
Data Studio is now available in Sudan
Users in Sudan can now tell beautiful data stories with Data Studio. Welcome!
February 11, 2021
Product updates
Improved data source collaboration
Data source editors can now edit the connection, refresh fields, and update credentials of data sources. (Prior to this, only the data source owner or credential owner could do these things).
This makes collaborating on reports and managing your data sources even easier. In particular, collaborating on reports with embedded data sources is more convenient, as your fellow report editors now have greater control over those data sources.
Documentation updates
Restructured data source and data modeling topics
We've reorganized the Help Center topics covering connecting to your data, creating data sources, and modeling your data a bit. Create and edit data sources now has 2 child topics:
- Model your data
- Contains articles covering creating calculated fields, dealing with date and time, and aggregation.
- Control access to your data.
- Covers data credentials, row-level email filtering, and community connector authorization.
February 4, 2021
Product updates
Improved handling of unrecognized date formats
If you connect to data that contains ambiguous dates or times, you may now see a message saying "Data Studio can't convert [field] to a date" and some tips on how to resolve the issue.
January 28, 2021
Product updates
Traffic source fields from Google Analytics 4
You can now visualize Google Analytics 4 traffic source fields:
- Session Google Ads ad group ID
- Session default channel grouping
- Session medium
- Session campaign
- Session source
- User Google Ads ad group ID
- User Google Ads ad group name
- User Google Ads ad network type
- User medium
- User campaign
- User source
To see these fields in your existing GA4 data sources, refresh the fields.
Restoring data source versions now requires proper credentials
To view or restore version history for a data source, you must now either own the credentials for that data source, or the data source must use Viewer's Credentials. This helps prevent possible unauthorized access to the data.
January 7, 2021
Product updates
News searches in Search Console
You can now see news search results data in your reports using the Search Console connector. Learn more.
Create Boolean calculated fields without CASE
You can now use a Boolean expression as a calculated field formula. For example, Revenue > Forecast, which returns true or false. You can then use these fields within other calculated fields. (Previously, you had to use CASE statements to achieve the same result.)