Use the Cohort report to gain insight into how your users are behaving and being monetized since installing your app.
In this article:
Overview of the Cohort report
Cohorts are groups of users that installed and opened your app within the same time period. For example, all users who installed and opened your app on July 1 belong to the same install cohort.
The report provides the lifetime value (LTV) of a user cohort, including:
- LTV: The overall LTV for a user cohort, including revenue from in-app purchases, ads, and subscriptions.
- IAP LTV: The LTV from in-app purchases for a user cohort.
To view IAP LTV data for your Android apps, you must:
- Link your app to a Firebase project.
- Link your Google Play account to the Firebase project.
- Ads LTV: The LTV from ads revenue for a user cohort. The ads revenue is the total revenue from the AdMob Network, your bidding ad sources, and your estimated third-party revenue.
- Subscription LTV: The LTV from subscriptions for a user cohort.
The Cohort report also provides the retention rate of a user cohort. Retention is the percentage of users in a cohort who continue to open your app after install. Learn more.
Benefits of using the Cohort report
It can be helpful to track cohorts to learn about your users’ behavior. This can help you make data-driven decisions about your engagement, user acquisition, and monetization strategy.
Consider using this report to:
- Inform your user acquisition strategy (What bid should I set?)
- Identify which countries are most valuable (Which countries have high LTVs?)
- Understand the breakdown of revenue (Is more revenue coming from IAP or ads?)
- Compare your apps' performance (Compare a new app's D1 LTV to an older app's D1 LTV)
- Understand how users respond to changes in your app (Does LTV increase after making certain changes in the app?)
Understanding cohorts
Users are grouped into a cohort on the day they install and open your app for the first time; this is called D0. Dx denotes the number of days since install. You’ll be able to see average per-user data for the following cohort milestones:
- D1: The day after the user installed your app.
- D3: 3 days after install.
- D7: 7 days after install.
- D14: 14 days after install.
- D28: 28 days after install.
- D60: 60 days after install.

In the example report above, D3 LTV is $0.013 for install week 3/8/2020 - 3/14/2020. This means that on average, a user who installed in that week earns a cumulative revenue of $0.013 via ads or IAP between the day they install and 3 days later.

Also note that some rows in the example above don’t show data for all metrics. This means that the cohorts in that install week haven’t reached all the milestones yet.
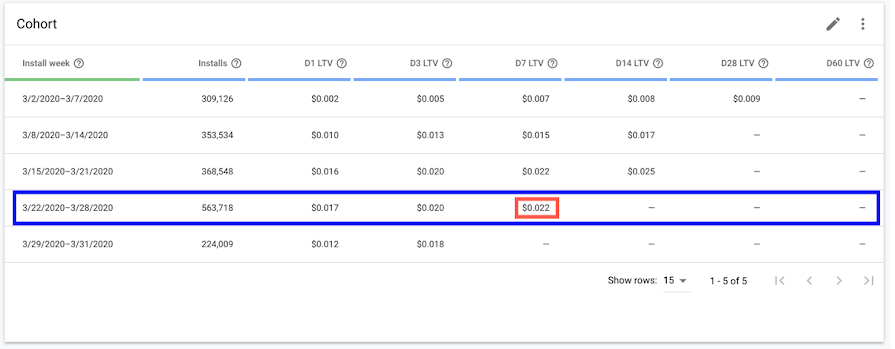
Some cohorts are also “partial” in that not all users in the cohort have reached the milestone. Let’s look at a partial cohort in the example report above and assume the report is run on 4/1/2020.
For install week 3/22/2020 - 3/28/2020, users who installed on 3/28/2020 have not reached the D7 milestone (they will reach the D7 milestone on 4/4/2020) and are therefore not included in the D7 LTV calculation.
FAQs
Why do I see a decrease in LTV for higher milestones like D28 and D60?
Some cohorts are also “partial” in that not all users in the cohort have reached the milestone. For example, Cohort A installed 7 days ago, while Cohort B installed 30 days ago. This means that Cohort B data is included in the D28 milestone, but Cohort A data is not since they haven’t reached D28 yet.
So for higher milestones, like D28 and D60, you may see a decrease in LTV from the lower milestones. This is because there are less cohorts included in the calculations for higher milestones.
Why is D0 retention less than 100%?