The path exploration techniques lets you do things like:
- Find the top pages that new users open after opening the home page.
- Discover what actions users take after an app exception.
- Uncover looping behavior which may indicate users becoming stuck.
- Determining the effects of an event on subsequent users actions.
Create a path exploration
- Sign in to Google Analytics.
- On the left, click
Explore.
- At the top of the screen, select the Path exploration template.
To get started, Analytics provides a sample implementation.
You can click Start over in the top right to start with a new path exploration. If you click Start over, you can select the starting point or ending point of the exploration. Then, you will select the kind of data to use as the starting point or ending point of your exploration.
For example:
-
Under STARTING POINT, click to choose a dimension, or drag and drop a dimension from the NODE TYPE list to the STARTING POINT.
-
Choose the event name, page title, page path, screen name, or screen class as the starting node.
-
Choose a value for the dimension.
Your new path exploration appears. On the left is the starting point you selected. To the right is STEP +1, which shows the top 5 screens that your users viewed or events they triggered after that starting point. You will also have the option to view more screens if available.
See your users' next steps
To see the next steps your users took, click a data point in the graph. (Data points in a path exploration are called nodes.)
Click a node to expand it and add a new step. Click the node again to collapse it. Nodes that appear in gray are at the end of the user's path and can't be expanded.
By default, the graph shows the top 5 nodes in a step. Click + More to add up to 20 nodes per step. More nodes beyond the top 20 are grouped into an "Others" node.
See your users' previous steps
By default, path exploration shows your users' actions working forward from a specific event or page. Backwards pathing lets you select a desired event or page and explore how your users got to it. You can select an event, like a purchase or another key events, and explore the different paths your users take to reach that event. Then, you can use that insight to improve the user experience.
To create a backwards path:
- Create a new path exploration following the directions above.
- In the upper right, click Start over.
- Click in the ENDING POINT box to select the node that ends the path.
You can then configure the rest of the exploration in the same way as a forward path.
How path exploration works
Path exploration uses a tree graph to illustrate the event stream, the collection of events users triggered and the screens they viewed.
A path exploration graph consists of the following elements:
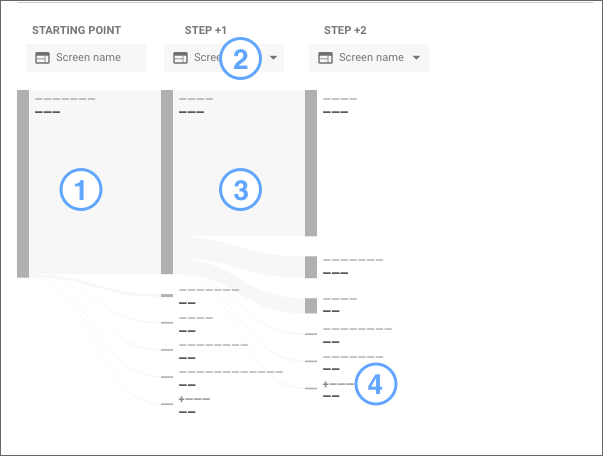
Legend:
- Starting / Ending point
- Node type
- Node
- Add node
Starting / Ending point
The starting point is the screen or event that begins the path you want to explore. It appears as the leftmost column in the visualization.
For example, begin an ecommerce path with a page that offers choices for different categories of shoes (e.g., men's, women's, athletic, etc.)
The ending point is the screen or event that ends the path you want to explore. It appears as the rightmost column in the visualization.
A path exploration can have a starting point or an ending point but not both.
Steps
Steps are the columns in the graph. Each step after the starting point or before the ending point represents the successive or previous actions of viewing a screen or triggering an event.
For example, STEP +1 is the list of screens viewed or events triggered by your shoe shoppers after opening the footwear product page starting point.
Nodes
Nodes are the data points within steps, representing the number of users or events at that point in the path.
For example, the Men's Shoes node in STEP +1 represents the number of shoppers who opened that page, or the number of events that were triggered from that page.
Node type denotes the dimension values you'll see in each step of the graph. You set the node type for the starting point when you create a new path exploration. You can switch node types for a step using the menu above the step.
Path
A path is a specific sequence of nodes occurring across one or more steps, within a specified time frame.
How paths are calculated
Forward path exploration takes the starting point you provide and then examines the event stream to find the next screens viewed or events triggered by your users immediately after that starting point. Backward path exploration is the reverse: it examines the event stream to find the screens viewed or events triggered immediately before your selected ending point.
These screens and/or events are then aggregated together into paths. The numbers shown in each node represents the total number of users or events that contributed to that particular point in the path.
Paths and sessions
Paths are calculated from the user's event stream, using the first instance of the dimension value you select as the starting or ending point.
Paths can span one or more sessions, depending on the date range you choose. A new session begins if a user is inactive for 30 minutes. If a path spans multiple sessions, the data for a node is an aggregation of all sessions.
Single session example
In the same session, a user opens the following screens:
Home > Product A > Home > Product B
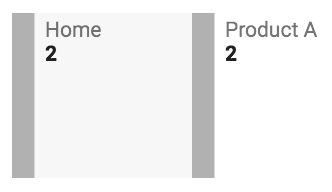
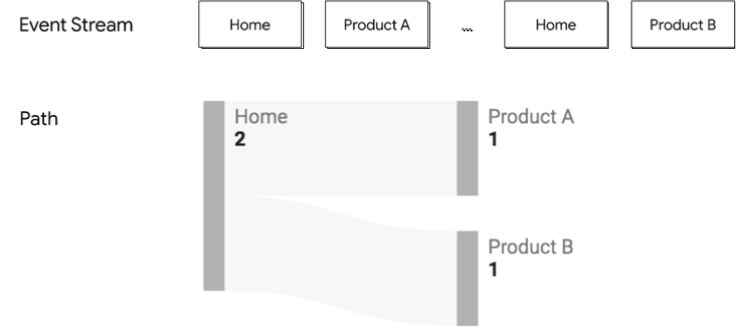
The images below illustrate how path exploration visualizes this user journey, using the first instance of the Home screen_view event as the starting point, and then adding steps as you expand the nodes:
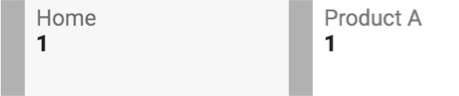
Initial view of the path showing the starting point and STEP +1.
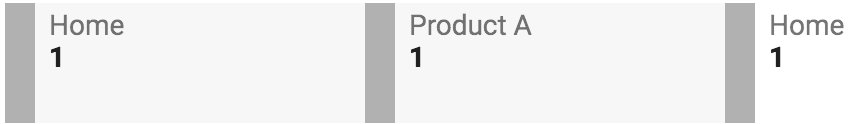
Path with STEP +2 expanded.
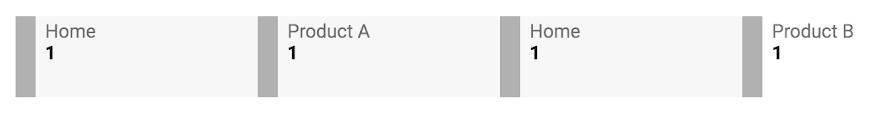
Path with STEP +3 expanded.
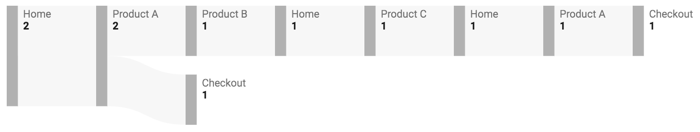
Cross-session example
Over the course of a week, in two different sessions, the user performs the following actions:
Session 1: Home > Product A > Product B > Home > Product C
Session 2: Home > Product A > Checkout
An initial view of this path for Event count looks like this:
You can explore this path in two ways:
To see the aggregated paths, expand the Product A node. This adds Step +2 and shows each session as its own individual path.

To see the complete cross-session path, expand all the nodes to show the 8 steps following the starting point.
Change the type of data shown in each step
Node type determines what kind of information to display in a step. Use the menu at the top of a specific step to display that node type in that step.
Change the exploration metric
By default, path exploration calculates the event count for each node in the graph. You can easily apply a different metric calculation:
To apply a metric:
- On the left, in Variables, select one of the supported metrics from the list and drag it to the Variables target in Settings.
Supported metrics
Path exploration currently supports the following metrics:
Event count
The Event count metric counts the number of events triggered for each node of a path. Event count is the result of aggregating across all users and all sessions in the exploration time frame.
For example, when a user opens the home page, navigates to a product page, then returns to the home page before navigating to another product page, all within 30 minutes, the path shows two home screen_view events for the home page and one screen_view event for each product page in the first step.
Total users
The Total users metric represents the number of unique users who viewed a screen or triggered an event in the exploration time frame.
For example, when a user opens the home page, navigates to a product page, and then returns to the home page before navigating to another product page within the time frame selected, the path will show one home page user on the starting point and one product page user for each product in the first step.
Include or exclude data from path exploration
You can customize the data shown in path exploration to focus on the most relevant information using the following options:
Select which nodes appear in the graph
To choose which nodes appear in each step of the graph:
- At the top of a step, click Edit
.
- Use the checkboxes to include the screens or events you want to see in that step.
The values you select determine which individual nodes to display in that step. Unselected values are grouped into the + More node.
To remove a node from the graph, see exclude nodes below.
Exclude nodes
You can remove nodes if they aren't relevant. Excluding a node only hides it from the graph, but doesn't change how the path is calculated. To exclude data from the event stream before it is used to calculate paths, consider applying a segment.
To exclude a node from the graph:
- Right-click the node.
- Click Exclude node.
- Decide how to exclude the node:
- Selected only. This option excludes the node from the current path in the current step. Any subsequent steps along this path from this node are removed from the exploration.
- From all paths. This option excludes the node from any path in any step of the exploration.
You can see a list of the nodes you've excluded in Tab Settings, under NODE FILTERS. To re-add nodes you've excluded, hover over one of the filters and click X.
View unique nodes only
This option allows you to perform a path exploration that displays only changing values of your nodes.
For example, if you want to see how your users navigate through the pages on your website or screens in your app, and there are multiple events tracked for each page or screen, this option will display only one node for each even if the user performed many consecutive events on that page or screen. However, If the user then comes back to that page or screen after they visited another page or screen, it will show again in the path.
Apply segments
Segments let you define the subsets of users or events you want to include in or exclude from an exploration. For example, you can explore the paths taken by converting or non-converting users to find out where their user journeys diverge. You could also create a path exploration based on a subset of important events. This is particularly helpful if you have many events in a session but want to see the path across only a specific subset of them.
Learn more about building segments.
To apply a segment:
On the left, drag an existing segment from the Variables panel to the segment target in the Tab Settings panel.
Segments are applied to the event stream before the path exploration is calculated. This means that events or users you've excluded in the segment are not part of the exploration's event stream, and therefore are not part of the path calculation.
Apply filters
You can apply filters to the exploration based on any of the available dimensions and metrics. For example, you can show only paths with a minimum number of users or events, or paths that occurred on selected browsers or operating systems.
Filters are applied to the exploration before the paths have been calculated.
Apply a breakdown dimension
Use a breakdown dimension to see how the path data is grouped along that dimension. For example, you can see user paths broken down by country or device category.
To apply a breakdown dimension:
On the left, drag an existing dimension from the Variables panel to the breakdown dimension target in the Tab Settings panel.
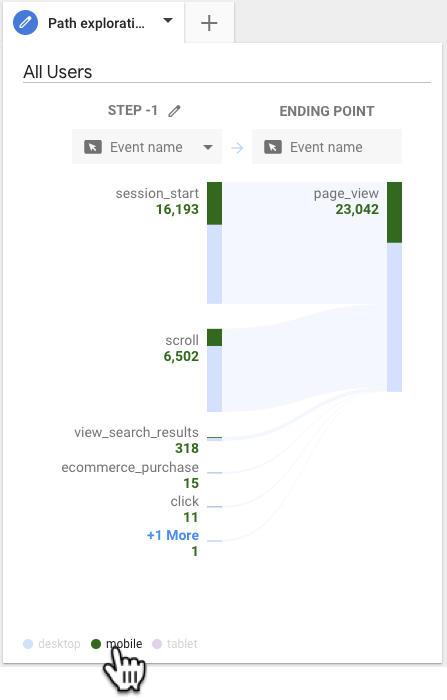
The top 5 values for the selected dimension appear at the bottom of the exploration. Hover over a value to see that value's breakdown in each node. For example, the backwards path exploration below uses the Device Category dimension as a breakdown. Hovering over mobile shows the number of mobile users in each node:
Related resources
Path exploration is similar to other Analytics features, but offers some advantages:
- Like multi-channel funnels in Universal Analytics, path exploration explores the steps users take through your site or app, but path exploration gives you ad hoc exploration of multiple paths vs. exploration of a single, predefined path.
- The users flow and behavior flow reports perform similar analysis based on pages, while path exploration can visualize paths using both page or screen views and events.