The Behavior Flow report visualizes the path users traveled from one page or Event to the next. This report can help you discover what content keeps users engaged with your site. The Behavior Flow report can also help identify potential content issues.
In this article:Behavior Flow report requirements
You must have set up and be tracking Events before they appear in the Behavior Flow report. The more organized you are about setting up the Event tracking code, the easier it is to use the Events or Pages and Events views of the Behavior Flow report. You must also have set up Content Groupings before they appear in the report.
Access the Behavior Flow report
To access the Behavior Flow report:
- Sign in to Google Analytics.
- Navigate to your view.
- Open Reports.
- Select Behavior > Behavior Flow.
How to use the Behavior Flow report
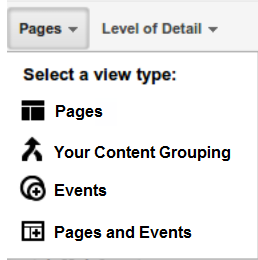
Use the view type selector at the top of the report to see user movement between Pages, Content Groupings, Events, or both Pages and Events.
Structure of the Behavior Flow report
Like all flow reports, the Behavior Flow report displays nodes, connections and exits, which represent the flow of your traffic.
Nodes are points through which traffic flows. Depending on which view you've chosen, each node in this report represents one of the following:
- one value of the starting dimension by which you're filtering the visualization, e.g., Landing Page or Country/Territory. This type of node is found in the first column of either the Pages or Events view.
- a single page or collection of pages, e.g., all pages in the wearables directory. This type of node is found in either the Pages or Pages and Events view.
- a group of pages and Events that you've grouped together by tracking code, extraction rules, and/or rule definitions. This type of node is found if you select a view for a Content Grouping you've set up.
- an Event, e.g., a video play or download. This type of node is found in either the Events or Pages and Events view.
In this report, page nodes are green, event nodes are blue, and dimension nodes are white. Click a node to highlight or explore traffic through that node, or to see the individual pages or events that are grouped together in that node.
A connection represents the path from one node to another, and the volume of traffic along that path. Click a connection to highlight just that traffic segment through the flow.
An exit indicates where users left the flow. In Events view, exits don't necessarily indicate exits from your site; exits only show that a traffic segment didn't trigger another Event. Exits aren't currently shown in the Pages and Events view.
Analyze user engagement with the Behavior Flow report
Use the Behavior Flow report to investigate how engaged users are with your content and to identify potential content issues. The Behavior Flow can answer questions like:
- Did users go right from product pages to checkout without any additional shopping?
- Is there an event that is always triggered first? Does it lead users to more events or more pages?
- Are there paths through your site that are more popular than others, and if so, are those the paths that you want users to follow?
