Los segmentos y los filtros permiten visualizar datos para interpretar un subconjunto de datos según determinados criterios.
- Los filtros son exploraciones que muestran un conjunto de datos limitado. Se aplican a la exploración que esté usando en ese momento.
- Los segmentos son grupos de usuarios, sesiones o eventos que usted define. Estarán disponibles en cualquier pestaña de la exploración que esté usando.
Comparar segmentos
Para comparar un segmento con datos específicos de una exploración, arrastre un segmento del panel Variables al panel Configuración de la pestaña en Comparaciones de segmentos.
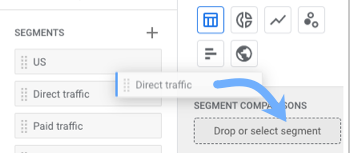
Puede añadir varios segmentos a Configuración de la pestaña. Para visualizar cómo se relacionan entre sí diversos segmentos, use la técnica Superposición de segmentos.
Crear segmentos a partir de sus datos
Si su exploración muestra una cohorte de usuarios, sesiones o eventos que quiere seguir, puede guardar esa cohorte como segmento o audiencia.
- En el lienzo, haga clic con el botón derecho en los datos.
- En el menú emergente, haga clic en Crear segmento a partir de la selección. En el panel de navegación lateral puede usar ese segmento para crear una audiencia.
- Asigne un nombre personalizado al segmento y, a continuación, haga clic en GUARDAR.
El nuevo segmento aparecerá en el panel Variables de la sección Segmentos. Podrá arrastrar el segmento a la sección Comparaciones de segmentos de cualquier exploración. Más información sobre cómo crear segmentos
Crear filtros
- Vaya a la parte inferior del panel Configuración de la pestaña y, en la sección Filtros, haga clic en el cuadro "Suelte o seleccione una dimensión o una métrica" y elija una métrica o dimensión de la lista emergente. También puede arrastrar dimensiones y métricas del panel Variables al cuadro.
- En la lista que aparece debajo de la selección, elija cómo quiere filtrar los datos usando la condición. La dimensión o métrica que haya seleccionado en el paso 1 determinará las opciones de filtrado disponibles.
- Escriba los criterios que el filtro debe evaluar. En estos criterios se distingue entre mayúsculas y minúsculas.
- Haga clic en Aplicar.
Ver usuarios

El informe "Exploración de usuarios" le permite examinar el comportamiento de cada usuario en lugar del comportamiento global. En este informe se muestran los usuarios que componen los datos de sus exploraciones:
- En el lienzo, haga clic con el botón derecho en los datos.
- En el menú emergente, haga clic en Ver usuarios.
- Se abrirá el informe Exploración de usuarios, donde se mostrarán los usuarios que conforman esos datos.