| This feature is only available in Analytics 360, part of Google Marketing Platform. Learn more about Google Marketing Platform. |
If you are an Analytics 360 customer and have asked your account manager to link your Campaign Manager 360 account to Analytics, you'll see a new set of Campaign Manager 360 reports in the Acquisition > Google Marketing Platform section. Additionally, you'll see Campaign Manager 360 activity in the Source/Medium, Multi-Channel Funnels, and Attribution reports.
In this article:Differences in attribution models
When looking at data from the Campaign Manager 360 reporting integration, note which attribution model each report uses. The Campaign Manager 360 reports use the CM360 Model (i.e., the Campaign Manager 360 Model). Most other Analytics reports (such as the Source/Medium report) use a different attribution model, which is called the GA Model in Google Marketing Platform advertising products integration reports and dimensions.
The Conversions reports (Multi-Channel Funnels and Attribution reports) use the Last Interaction model by default, which attributes credit for conversions to the last interaction before conversion. You can compare other attribution models in the Model Comparison Tool.
CM360 Model
The CM360 Model attributes Analytics sessions to Campaign Manager 360 campaigns by considering Campaign Manager 360 only and ignoring all other channels driving traffic to your site. This means that an Analytics session will be mapped to a Campaign Manager 360 campaign if the user ever viewed (View-through) or clicked on (Click-through) your Campaign Manager 360 ad at any time within the lookback window before visiting your site.
Example
If a user views your Campaign Manager 360 ad, then clicks on your Search ad and visits your site, the Campaign Manager 360 reports will attribute the session to the Campaign Manager 360 campaign as a View-through session. However, all other Analytics reports (including Source/Medium) would attribute this session to Search.
Similarly, if a user clicks on your Campaign Manager 360 ad and then visits your site, the Campaign Manager 360 reports will attribute the session to the Campaign Manager 360 campaign as a Click-through. If the next day, the same user clicks on an Organic Search result and visits your site, the Campaign Manager 360 reports will still attribute the new session to the Campaign Manager 360 campaign as a Click-through.
GA Model ("Last Non-Direct Click")
Most other Analytics reports attribute a Source/Medium to each session based on the Last Non-Direct Click model, where direct visits from returning visitors are ignored and attributed to a preceding campaign (if it exists).
Example
If a user clicks on your Campaign Manager 360 ad and visits your site, the Source/Medium of the session will be dfa/cpm.
However, if the next day, the same user clicks on an Organic Search result and visits your site, the GA Model will label the Source/Medium of the new session as google/organic.
The Campaign Manager 360 reports
The Campaign Manager 360 reports include all sessions from users exposed to your display ads during your lookback window (e.g., the last 30 days, or any other period specified in your Campaign Manager 360 interface). For example, if a user was served a display ad impression last week, the Campaign Manager 360 reports would include her session yesterday.
The percentage of traffic from people exposed to your Campaign Manager 360 ads appears in the top left of any Campaign Manager 360 report.
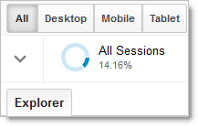
In this example, 14.16% of the total sessions came from people who saw or clicked one of your Campaign Manager 360 ads. The Campaign Manager 360 sessions are divided into two categories: View-through and Click-through. View-through sessions come from people who were served your ad at least once during the lookback window. Click-through sessions come from people who clicked at least one of your ads during the lookback window.
Use the Clicks tab for ROAS analysis of your Campaign Manager 360 campaigns, similar to the Clicks tab on the Google Ads reports.
Note: The cost data reflects what is entered into Campaign Manager 360; it is not from the billing system. If you don't initiate cost data import, you won't be able to see Campaign Manager 360 cost, impression, or click data in the Analytics reports.
When cost data is available, you can see it under the Clicks tab in the Campaign Manager 360 reports.
Use the reports
The Campaign Manager 360 reports help you understand what happens after people are exposed to your display ads. For example:
What's the conversion rate for people who saw a specific ad? Go to the Ads report. Click one of the Goal Set, Ecommerce, or Floodlight tabs, and look at the View-through conversion rate for the ad.
Do people who previously clicked an ad stay on the site longer than people who only saw ads? Go to the Advertisers report. Compare Avg. Session Duration for View-throughs and Click-throughs.
You can answer these kinds of questions for specific ads, placements, sites, campaigns, creatives, and other Campaign Manager 360 dimensions. Go to the report you need or select a Campaign Manager 360 dimension above the table in any report.
Use the Floodlight report to investigate Floodlight conversions and revenue for your Campaign Manager 360 activities and activity groups.
The Acquisition > All Traffic > Source/Medium report
The Source/Medium report includes all sessions to your site. Sessions that resulted from display ad clicks are grouped into the Source/Medium of dfa/cpm.
The dfa/cpm traffic shown in Source/Medium is different from what is shown in the Campaign Manager 360 reports. The Campaign Manager 360 reports show sessions from people exposed in the past to your Campaign Manager 360 ads (either via an impression or click). Source/Medium only shows sessions where the last non-direct click-through visit was from your Campaign Manager 360 ad.
Use the report
Use the Source/Medium report to:
- Compare display ad click traffic to other traffic, such as paid keyword and organic search traffic.
- Drill down to see engagement metrics and conversion rates by ad, site placement, and other Campaign Manager 360 attributes.
Use this report to investigate questions like:
What percentage of sessions came from display ad clicks? Go to the Source/Medium report. Change the graph selector to Percentage and look for dfa/cpm.
Did users from display ads spend more or less time on site than users from Google organic search? Go to the Source/Medium report. Compare Avg. Session Duration for dfa/cpm and google/organic.
Which display ad referred traffic with the lowest bounce rate? Go to the Source/Medium report. Click dfa/cpm in the table. Select CM360 Ad as the primary dimension in the table. Compare Bounce Rate for each ad.
Which display placement sends the most qualified traffic? Go to the Source/Medium report. Click dfa/cpm in the table. Select CM360 Placement as the primary dimension in the table. Compare Bounce Rate for each placement. Next, click one of the Goal Set, Ecommerce, or Floodlight tabs, and look at the conversion rates for each placement.
The Conversions > Multi-Channel Funnels reports
The Multi-Channel Funnels reports are generated from conversion paths, the sequences of clicks and ad impressions during your lookback window (e.g., the last 30 days, or any other period of time you've specified in your interface). The reports only include sessions that were part of a conversion funnel. So, if a user clicked one of your display ads, but never returned to your site to convert, your Multi-Channel Funnels reports don't display that ad session.
Use the reports
Because the reports exclusively focus on the sessions that led up to conversions, Multi-Channel Funnels gives you insight into the role that display played —and the role that specific ads, creatives, etc. played—in your conversions. For example:
What keywords did eventual customers search for after they saw a display ad? Go to Conversions > Multi-Channel Funnels > Top Conversion Paths. Click the CM360 filter at the top of the report.
Change the primary dimension to Other > Acquisition > Keyword (Or Source/Medium) Path. Campaign Manager 360 interactions are labeled dfa/cpm in the paths. You can now see the keyword searches that occurred after dfa/cpm.
The Conversions > Attribution Reports
The Model Comparison Tool allows you to compare different models of assigning credit to display. Choose from several basic models of assigning credit for display clicks and impressions, or create your own model that assigns credit for clicks and impressions in the way that makes most sense for your business.
Compare attribution models to identify Campaign Manager 360 advertisements that may be over- or undervalued in your current attribution model and adjust investments accordingly.
Use the Model Comparison Tool
To use a basic attribution model: Click the CM360 filter at the top of the report. Select one or more attribution models from the drop-downs above the table. Then, select a primary dimension to evaluate the desired aspect of Campaign Manager 360 campaigns, such as campaign, site, placement, ad, or creative.To create a custom model: Select Create new custom model from the Select model drop-down menu. Name your model, and choose one of the five baseline models to determine how to distribute credit to touch points in the conversion path.
Use the Adjust credit for impressions section to set an overall rule for how impressions are valued. If desired, use Advanced Option to specify a different level of credit for impressions that precede a session within a certain time window. For example, you could value all impressions 1/10 as much as a click but value impressions that occur within two minutes of a session 1/5 as much.
Use the Adjust credit based on user engagement and Apply custom credit rules sections to further customize your attribution model.
Floodlight conversion data
Click the Floodlight option on the Explorer tab to see Floodlight conversion data in most other reports. You can also select Floodlight dimensions and metrics when creating custom reports and segments.
Related resources
Learn more about Campaign Manager 360 and Analytics:
Learn more about the reports and features mentioned in this article:
