New to Analytics? Use this interface map and the numbered sections below to familiarize yourself with the main Reporting tools and controls.

Note: access to certain features or pages in Analytics depends on your permissions. Additionally, some features are only available to 360 users. So it's possible you won't see all the elements or features described here.
 Organization and account links, search
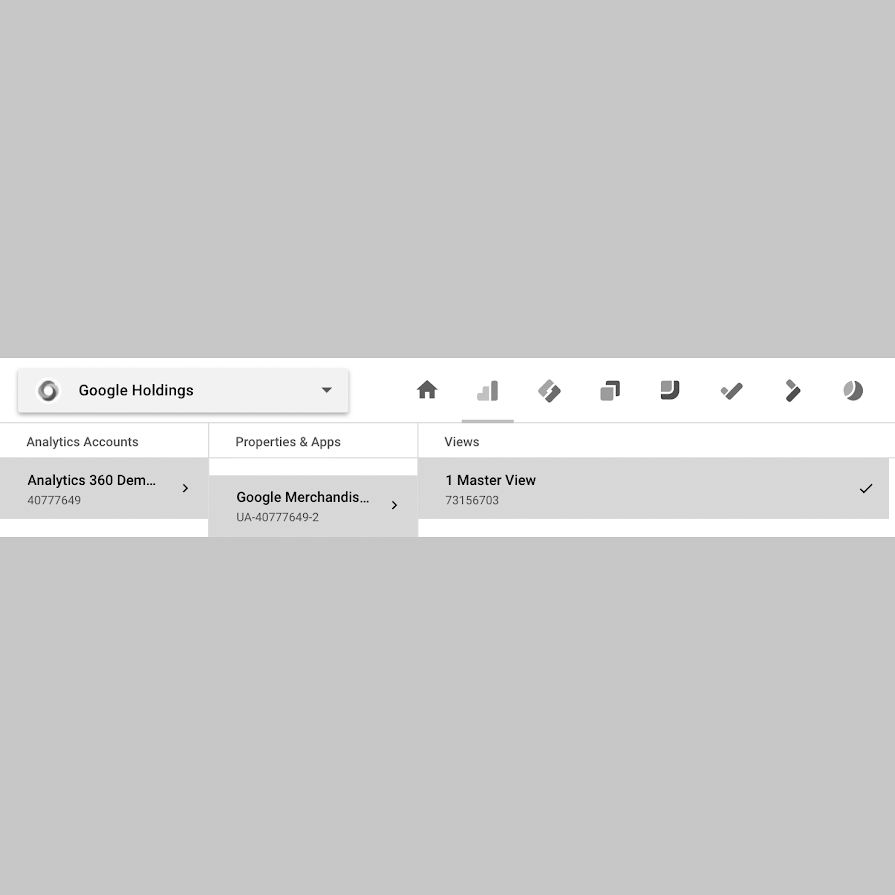
The breadcrumb links at the top of every page in Analytics give you access to the Google Marketing Platform organizations and product accounts, as well as Analytics accounts, properties, and views associated with your current login credentials.
- Organization: Within Google Marketing Platform, the representation of your company, and the management framework for your company’s product accounts and users. Learn more
- Product accounts: Other Google Marketing Platform product accounts like Tag Manager and Optimize.
- Account: Your access point for Analytics, and the top-most level of organization within the product.
- Property: A website, mobile application, or device (e.g. a kiosk or point-of-sale device.) An account can contain one or more properties.
- View: Your access point for reports; a defined view of data from a property.
Learn more about accounts, properties, and views.
Use the search box to search Analytics for reports, ask questions, and query for help content.
Back to top Diagnostics and Google accounts

Every page in Analytics also gives you access to notifications and diagnostic messages, and lets you manage your Analytics user settings and your Google accounts.
- Click
to see any messages generated by Analytics' automated diagnostics.
- Click
to change user settings, send feedback to Google, or get help with Analytics.
- Click
to manage your Google account, and to sign out of Analytics.
 Report navigation

This is where you access all of your reports.
- Click a report category to open that list of reports.
- The Customization category includes Dashboards, Shortcuts, and Custom Reports.
- Click
to open Admin, where you manage your accounts, properties, and views.
Throughout this Analytics Help Center, you'll see references to reports like this: Acquistion > All Traffic. This is a shorthand meaning, "the All Traffic report in the Acquisition category.
 Action bar

The action bar appears at the top of the reports in Analytics. The action bar includes the report title, the sample percentage, controls that act on the report as a whole, and a link to the Intelligence panel.
- The sample percentage tells you what percentage of sessions during the date range are included in the report. You can switch between a smaller sample (faster response time, less precision) or a larger sample (slower response time, greater precission).
- Click Save to save the current configuration of the report.
- Click Export to export your report data for use in other applications like Excel.
- Click Share to share a report, even if the recipients don't have Analytics accounts.
- Click Intelligence to open the Intelligence panel, where you can see insights from your data generated by Analytics machine learning, and query your data using natural language.
 Add segments, set the date range
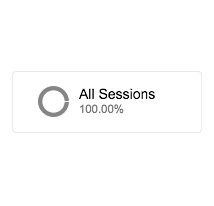
A segment is a subset of your Analytics data. Add segments to a report to compare different subsets of data.
- Click + Add segment to add existing segments or create new ones.
- Click a segment to edit, copy, or remove it. (You can't edit the default system segments.)
Use the date selector to change the date range of the report, and chose date ranges to compare.
Back to top Report tabs
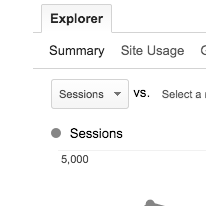
Analytics reports display data in one or more tabs, providing multiple views of the data in one place. Most standard reports include an Explorer tab, which typically has 2 parts: a graph of your data on top, and a data table below. Some reports include additional tabs like Overview or Map Overlay.
Use the metric-group links below the tab label to determine which metrics are shown in the data table: for example, Summary, Site Usage, Goal Set 1.
Back to top Graph
Graph

The top portion of most Explorer tabs displays a graphical view of your data. Graph controls include:
- Graph metric selector: change the metrics plotted on the graph view. You can compare 2 metrics on the graph; for example, Sessions vs. Bounce Rate. Located below the metric-group links.
- Graph time-scale buttons: change the time-scale of the graph. Choose between day, week, or month. Located to the right of the graph metric selector.
Graph type buttons: change the graph display. Choose from line graph or motion chart. Located next to the graph time-scale buttons.
- Click
to open the Annotations drawer. You can make a note directly on the report. This control is located immediately below the graph's time axis.
 Data table

The lower portion of the Explorer tab displays data in tabular form. The primary dimension and metrics displayed depend on the type of report and on the metric group selected in the Explorer tab controls.
Data-table controls include:
- Primary dimension links: change the primary dimension in the report.
- Plot Rows button: add rows you've selected to the graph.
- Secondary dimension menu: add another dimension to the report.
To remove a secondary dimension, click X in the dimension column's header.
- Sort Type menu: change the order of the rows in the data table. Your choices are:
- Default: basic alphanumeric sort. The default order is high to low. You can change this by clicking the column header.
- Absolute change: sorts date range comparison data by amount of change rather than absolute values
- Weighted: sorts percentage data in order of importance instead of numerical order.
- Search: display only rows matching your search term. Click advanced to define more complex filters.
- Table display buttons: change the way the data table is displayed. Your choices include:
Data: displays the data in a tabular view. This is the default table view.
Percentage: displays a pie chart, showing the contribution to the total for the selected metric.
Performance: displays a horizontal bar chart, showing the relative performance for the selected metric.
Comparison displays a bar chart plotting the performance of the selected metrics relative to the site average.
Term cloud: displays a visual representation of the performance of keywords (not available for all reports)
Pivot: rearranges the information in the table for certain reports by pivoting your data on a second dimension.
There are a few additional controls not shown in the interface map image at the beginning of this article:
- Pagination controls: change the number of rows displayed, jump to a specific page of data, or navigate page by page using the controls below the data table.
- Refresh report link: update the data displayed in the report by clicking the link located at the very bottom of the page, next to the generation date.
Understanding and interacting with the data table
The first column of the table is the primary dimension. Your data is grouped by this column. If you select a secondary dimension, that appears in the next column, further grouping your data. The remaining columns in the table are the metrics associated with the selected dimensions.
You can perform a number of actions directly on the table, such as:
- Use the checkboxes preceding a row to select that row. You can then plot the selected rows on your graph view using the Plot Rows button.
- Hover over the ? icon in a column label to see a definition of that dimenion or metric.
- Sort the table by a column by clicking the column header. Note: this is a simple ASCII sort. To perform a more sophisticated sort, use the Sort Type button.
