Your AdMob reports are designed to give you insight into how much you're earning and what impacts those earnings. These reports include charts and tables so you can view trends and compare important metrics.
You can also customize and save your reports to help you keep track of how things change over time and get a better understanding of your data.
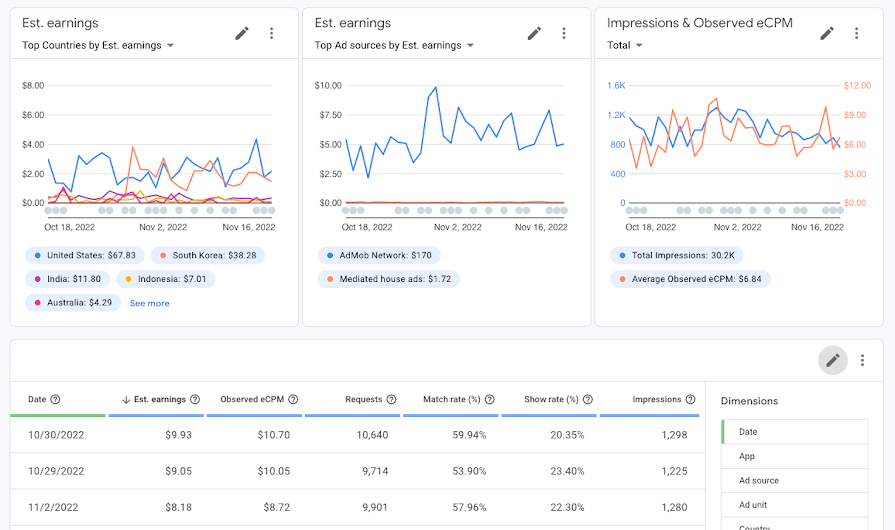
Customize your report information
Use filters, dimensions, and metrics to customize the information included in your reports:
- Filters: Use filters to understand your reporting data, find trends, and drill down to the information you really need. You can use filters to look at specific apps, ad units, countries or regions, and formats across a specified date range. Add multiple filters to your reports to further refine your data.
- Dimensions: Use dimensions help you to break down report data by certain attributes, such as the ad format or the platform an ad was viewed on.
- Metrics: Use metrics to specify what is being measured or analyzed. Metrics are quantitative measurements of the values in your data that you can use to understand your earnings and traffic better.
View reports with large data sets
Your AdMob reports are limited to 50,000 rows of data. If your report exceeds this limit, only the first 50,000 rows are visible. However, the totals displayed in the report will accurately reflect the overall data set, including those rows over the 50,000 limit.
If your report contains more than 50,000 rows, you can break your report into smaller ranges. For example, you could generate 12 monthly reports to review yearly reporting data rather than generating 1 annual report.