Metrics, along with filters and dimensions, determine what data is shown in your reports. They’re quantitative measurements of the values in your data that you can use to understand your earnings and traffic better.
What do metrics do?
Functionally, metrics represent the kinds of data or values contained in a report. They're usually arranged in columns and contain numbers or percentages. When dimensions are added, metric values are recalculated based on the new order or groupings the dimensions create. Adding or removing metrics adds or removes a column of information from the report.
Where are metrics in my reports?
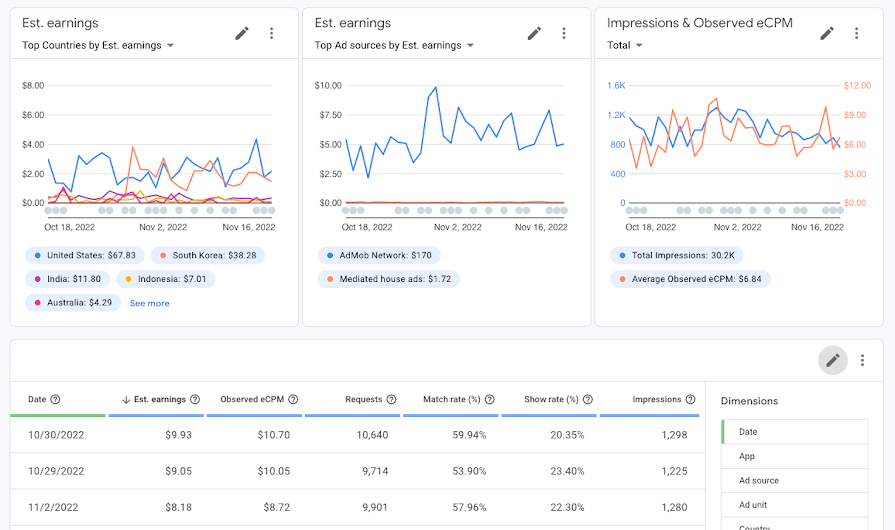
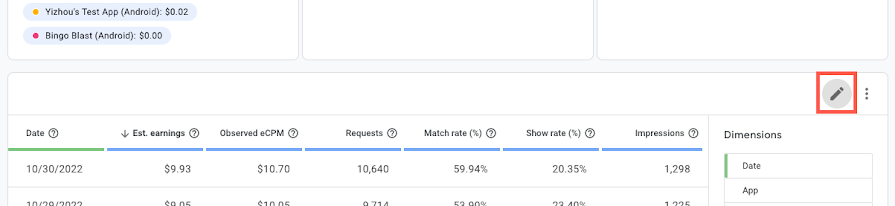
The list of available metrics in a report can be shown or hidden by clicking the icon at the top of the report table. They're displayed in the lower half of the right sidebar of the table.
The metrics already being used in a report are labeled with column headers and appear on the right side of your report table.
Change the displayed metrics
Not all available metrics are displayed in reports by default. You can edit the report table to select different metrics to display.
Complete the following steps to change which metrics are shown in your report:
- While viewing your report, click
at the top of the report table to open the list of available dimensions and metrics.
- Click the metrics you want to add or remove from your report. The selected metrics and data will be displayed in the report automatically.

Use metrics in charts
Metrics can also be displayed in charts at the top of your reports. Learn how to add a chart to a report.