The best way to see a business event's effect on performance is to do the following:
- Segment a report by the event's variable.
- Make sure the report's time range includes days before, during, and after the event.
The segmented report will show one row for each unique value of the variable during the report's time frame.
For example, an advertiser does the following:
- Uploads this event:
Row type
Action
Event start time
Event end time
c:Brand.ID
c:Brand.Discount %
c:Brand
append
2016-06-01
2016-07-01
Comfy Walkers
.20
-
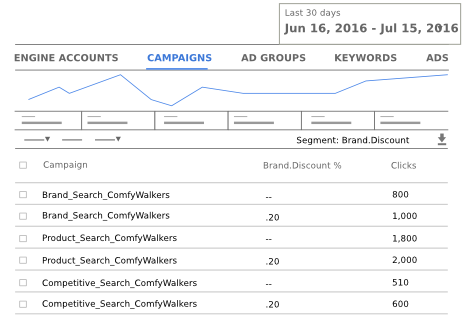
Views the campaign report and segments by Brand.Discount %.
DS automatically adds the Brand.Discount % column to the report. -
Sets the report's time range to the last 30 days, which includes part of the 20% discount event.
For each campaign, the Brand.Discount % column shows:
- One row with "--". This is the value of the Discount % variable from July 2 to July 15.
- One row with ".20". This is the value of the Discount % variable from June 1 to July 1.
View more detailed time segmentation
If you want to see the daily or weekly effect of the event:
- Add the event variable's column to a report.
- Segment the report by week or day.
Viewing an unsegmented report
Note that if you add the event variable's column to a report but you don't segment the report by time or by the event variable itself, the column always shows the current value of the event variable. Continuing the example above, if you add the Brand.Discount % column to a reporting table instead of segmenting by Brand.Discount %:
- If today's date is June 15, the column displays ".20"
- If today's date is July 15, the column displays "--"
View a list of all events
To see the full list of events that have been uploaded, download the business data table that contains the events. The downloaded bulksheet contains all events that have been defined in the table regardless of the report's time range.