As an agency, you put a lot of effort into adding negative keyword lists, tight match types, and other components to increase the quality score for an advertiser and get a high position for your ads. To show the impact of your work, you can include Google Ads and Microsoft Advertising Quality score (QS) in your Search Ads 360 reports. In Google Ads accounts, you can also include First page bids, and Top of page bids data. With this data, you can:
-
Create an automatic rule that adjusts bids, pauses keywords, or sends an alert based on the current quality score, first page bid, or top of page bid.
-
Chart the average quality score or first- and top-of-page bids over time for an entire account.
-
Compare quality score changes over time, which help you track whether your changes are actually improving quality score.
- Track quality score changes against changes in clicks and cost to explain changes in cost per click (CPC).
See the current quality score and first- and top-of-page bids
- Navigate to an advertiser, a Google Ads or Microsoft Advertising engine account, or lower scope.
Steps for navigating to an advertiser
-
Click the navigation bar to display navigation options.
-
In the "Agency" list, click on the agency that contains the advertiser. You can search for an agency by name or scroll through the list.
-
In the "Advertiser" list, click on the advertiser.
-
Click Apply or press the Enter key.
Search Ads 360 displays the advertiser page, which contains data for all of the advertiser’s engine accounts.
Note: If you have access to multiple advertisers, you can also view quality score and first- and top-of-page bids at the agency level. -
-
Click the Engine Accounts, Campaigns, Ad groups, or Keywords tab.
-
Optionally use a filter to display just the campaigns or ad groups you're interested in.
- Add the following columns to the reporting table:
-
Quality score (current) (reports data only for Google Ads and Microsoft Advertising keywords)
-
First page bid (current) (reports data only for Google Ads keywords)
-
Top of page bid (current) (reports data only for Google Ads keywords)
-
Note that you'll see the current quality score or first page bid regardless of the time range you've selected for the report.
Don't see these columns in the column list?
-
Make sure you're on the Advertisers, Engine Accounts, Campaigns, Ad groups, or Keywords tab. These metrics aren't available for specific ads, product groups, or other bid targets. In addition, if you're scoped to a specific engine account, make sure you're in a Microsoft Advertising or Google Ads engine account.
-
Make sure you haven't added any segments to the report other than date segments (days, weeks, or other time periods of a day or longer). Search Ads 360 cannot segment Quality score, First page bids, and Top of page bids by hour or any type of segment other than days, weeks, or other time periods of a day or longer.
Chart the average quality score or first page bids over time
At the keyword, ad group, campaign, and higher levels, you can see and chart historical, impression-weighted Average QS or First page bids. This is an impression-weighted average across all days and all keywords that you’re viewing in the current report.
- Navigate to an advertiser, a Google Ads or Microsoft Advertising engine account, or lower scope.
Steps for navigating to an advertiser
-
Click the navigation bar to display navigation options.
-
In the "Agency" list, click on the agency that contains the advertiser. You can search for an agency by name or scroll through the list.
-
In the "Advertiser" list, click on the advertiser.
-
Click Apply or press the Enter key.
Search Ads 360 displays the advertiser page, which contains data for all of the advertiser’s engine accounts.
-
-
Click the Engine Accounts, Campaigns, Ad groups, or Keywords tab.
-
Select a time range for the report.
For example, to see how the quality score changed during the last quarter, change the time range to Last quarter. -
In the upper right corner of the performance summary graph, click an existing metric (such as Impr▼ in the example below) or click Select a metric▼.
Then select Quality score (avg) or First page bid (avg).
The performance summary graph shows how the average quality score or first page bid for all of the items in the current scope has changed over the report's time range. For example, on the Campaigns tab, you'll see how the average quality score for all campaigns has changed over time.
Don't see these metrics in the list? See why -
Optionally apply a filter to show data only for specific items.
For example, you can use a filter to display only data for Shopping campaigns. -
To see the average quality score or first page bid for each item in the reporting table, add the following columns to the table:
-
Quality score (avg) (reports data only for Google Ads and Microsoft Advertising keywords)
-
First page bid (avg) (reports data only for Google Ads keywords)
-
Top of page bid (avg) (reports data only for Google Ads keywords)
For example, for each campaign on the Campaigns tab, you'll see the average quality score of all biddable items in the campaign during the report's time range.
-

Compare quality score changes
- Navigate to an advertiser, a Google Ads or Microsoft Advertising engine account, or lower scope.
Steps for navigating to an advertiser
-
Click the navigation bar to display navigation options.
-
In the "Agency" list, click on the agency that contains the advertiser. You can search for an agency by name or scroll through the list.
-
In the "Advertiser" list, click on the advertiser.
-
Click Apply or press the Enter key.
Search Ads 360 displays the advertiser page, which contains data for all of the advertiser’s engine accounts.
-
-
Click the Engine Accounts, Campaigns, Ad groups, or Keywords tab.
-
Add the following columns to the reporting table:
-
Quality score (avg) (reports data only for Google Ads and Microsoft Advertising keywords)
-
First page bid (avg) (reports data only for Google Ads keywords)
-
Top of page bid (avg) (reports data only for Google Ads keywords)
Don't see these columns in the list? See why
-
-
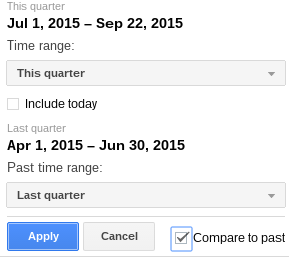
Use the time range selector to compare performance by time range.
For example, to compare the current quarter to the previous quarter, select This quarter as the current time range, then compare to Last quarter.
Details about average quality score and first page bids:
-
The averages are calculated across all days in the date range, with data available starting on the day you’re activated for the columns. If you select a date range that includes earlier dates, those impressions will not count toward the average.
-
Quality score (avg) is currently available only for the last 60 days at the keyword level. If you select a date range over 60 days ago, there will be no value in the column.
-
The Quality score (avg) chart in Microsoft Advertising accounts won't include data for the last two days in a current date range. For example, if you select Last 30 days in the time range selector to chart the average Quality score over a month, the last two days of the time period will report zeros. If you check the chart a few days later, you will see the data for the days that had shown zeros.
- The averages include all objects the report is scoped to. For example:
- If you filter to to a single keyword and chart the Quality score (avg) for the last month, the daily markers on the chart will show the historical QS pulled on each day that month. For each day in the chart, that is the QS number we pulled and stored for that keyword on that particular day. The Quality score (avg) value in the scorecard sums up that chart into a single number.
- If you then remove the filter on the keyword and look at an entire campaign, the chart shows the impression-weighted average quality score for all the keywords for each day (which is where the calculation described above applies). The scorecard then shows the Quality score (avg) for the campaign and the entire duration selected in the date range.
- If you see "--" reported for these metrics, there aren’t enough impressions or clicks to accurately determine the value.