See examples of Google Analytics account and property setups and learn the principles for organizing your account and properties
In Google Analytics 4, there are no views and you can perform separate collections of data. The granularity to which you separate your data and how you control access to it depends upon (1) your needs and (2) whether you use standard Google Analytics or Google Analytics 360.
This article is meant for structuring large business accounts. If you manage an account for a small or midsize business, you may not need to consider your account structure.
Example Google Analytics account setups
Business with one website
This business has one website and one Google Ads account. The business does not need to separate data according to region or line of business.
Google Analytics Standard account structure
- Account: One account. Data is owned by a single legal entity.
- Property: One property for the website
- Data streams: One data stream. If the business also has an app, a separate data stream for the app.
Principles applied
| Structure |
Rationale |
|
One Analytics account.
If there's an existing Analytics account, there's no need to create a new one.
|
Data is owned by a single entity in one location.
|
|
One Google Analytics 4 property with one (web) data stream.
|
A single property makes the data for each aspect of the site available in one place.
The marketing team can create audiences from any cross section of site data.
Analysts can understand cross-device usage, and whether there's a need for a mobile site or app.
|
|
One Google Ads account linked to the Google Analytics 4 property.
|
The marketing team can export audiences to Google Ads for remarketing and prospecting.
|
Educational institution/business
This organization has one website and one Google Ads account.
Business requirements
The account structure needs to address the following requirements:
- Students review course offerings, register for courses, and perform and manage course work online.
- The marketing team needs to be able to create audiences for remarketing and prospecting.
- Analysts want to understand cross-device usage and whether there's a need for a mobile site or app.
Google Analytics Standard account structure
- Account: One account. Data is owned by a single legal entity.
- Property: One property for each logical user base (institutional site).
- Data streams: One data stream for the institutional website.
Principles applied
| Structure |
Rationale |
|
One Analytics account.
If there's an existing Analytics account, there's no need to create a new one.
|
Data is owned by a single entity in one location.
|
|
One Google Analytics 4 property with one (web) data stream.
|
A single property makes the data for each aspect of the site available in one place.
The marketing team can create audiences from any cross section of site data.
Analysts can understand cross-device usage, and whether there's a need for a mobile site or app.
|
|
One Google Ads account linked to the Google Analytics 4 property.
|
The marketing team can export audiences to Google Ads for remarketing and prospecting.
|
Geographically distributed ecommerce retailer selling products via web and app
This umbrella corporation has multiple geographic regions and each region is its own business entity. Each region has its own website, marketing team, and Google Ads account. The umbrella corporation also has an app (available for iOS and Android).
Business requirements
The account structure needs to address the following requirements:
- The umbrella corporation needs to have a global view of data from all business entities.
- There is no need for each business entity to have legal ownership of its data.
- Each business entity wants to understand how the user journey moves across the website and app.
- Each business entity needs to compartmentalize its data.
- The marketing team for each business entity uses the Google Ads - Analytics link to create and share audiences, and uses the audiences for bidding in Google Ads.
Google Analytics Standard account structure
- Account: One account. Data is owned by a single legal entity.
- Property: One property for a single logical user base
- Data streams: One data stream for the website. One data stream for each version of the app.
Google Analytics 360 account structure
- Account: One account. Data is owned by a single legal entity.
- Property: One property for a single logical user base
- Subproperties: One subproperty for each business entity that has a need to compartmentalize data
- Data streams: One data stream for the website. One data stream for each version of the app.
Principles applied
| Structure |
Rationale |
|
One Analytics account.
If there's an existing Analytics account, there's no need to create a new one.
|
The umbrella corporation has legal ownership of the data for all business entities.
|
|
One Google Analytics 4 property.
|
A single property with data streams for web and app to make all the data available for inclusion in the same reports.
You can combine data for sites and apps as necessary to see how users journey between the two. The umbrella corporation has a unified view of all data, and can compare data between different business entities.
|
|
A subproperty for each regional team (360)
|
Each regional entity has its own subproperty with compartmentalized data. The umbrella corporation has a unified view of all data in the source property and can compare data between different business entities.
|
|
One data stream combining all regional business entity websites.
|
Use one web data stream for multiple domains.
|
|
One Firebase project for the Android and iOS implementations of the app. The Firebase project is linked to the Google Analytics 4 property.
One data stream each for the iOS and Android version of the app (i.e., two data streams).
|
A separate data stream for each app implementation makes it possible to isolate iOS vs Android data.
|
|
Each Google Ads account is linked to the property (standard)
|
With each Google Ads account linked to the single property, audiences from the property are available to each Google Ads account for bidding.
|
|
Optional: Each Google Ads account is linked to the appropriate subproperty (360)
|
With each Google Ads account linked to its appropriate subproperty, audiences from the property are available to each Google Ads account for bidding.
|
Global game developer with multiple games in Play Store and App Store
This business has one global brand website and a separate marketing site for each game title. It sells multiple game titles in the Play Store and App Store.
Business requirements
The account structure needs to address the following requirements:
- Collect first-party data from websites and apps to create audiences and inform media buying.
- A separate environment for development, staging, and production of each game.
Google Analytics Standard account structure
- Account: One account. Data is owned by a single legal entity.
- Property: One property for each logical user base (global-brand site; each game title's marketing site and app).
- Data streams: One data stream for the global-brand website. One data stream for each marketing site, and one for each corresponding version of the app.
Google Analytics 360 account structure
- Account: One account. Data is owned by a single legal entity.
- Property: One property for each logical user base (global-brand site; each game title's marketing site and app).
- Roll-up property: One roll-up property pulling together data from all separate source properties for a holistic view
- Data streams: One data stream for the global-brand website. One data stream for each marketing site, and one for each corresponding version of the app.
Principles applied
| Structure |
Rationale |
|
One Analytics account.
If there's an existing Analytics account, there's no need to create a new one.
|
Unifies properties under a single account owned by a single legal entity.
|
|
One Google Analytics 4 property for the global brand site, with one (web) data stream.
|
Separate measurement of the global brand site.
|
|
One Google Analytics 4 property for each game title’s marketing site and app. Each property has one (web) data stream, one iOS (app) data stream, and one Android (app) data stream.
|
Data from each marketing site and related app is collected in the same property.
Related site and app data is used to create audiences and inform media buying.
|
|
One Firebase project for each game. Each project is linked to the related property. Each Firebase project includes the development, staging, and production versions of the game.
|
A separate Firebase project for each game creates a separate environment for development, staging, and production of each game.
|
|
Optional: A separate Firebase project for each version of the game or for some combination of versions; for example one project for the development version, and another project for the staging and production versions.
|
You can further subdivide individual game environments by project, but this requires more properties if you want to measure the game version associated with that project.
|
|
Optional: Roll-up property. Each source property feeds into a roll-up property that provides a holistic view across web and app.
|
You can further subdivide individual game environments by project, but this requires more properties if you want to measure the game version associated with that project.
|
National insurance company with multiple independent subsidiaries (life, health, homeowners, auto)
This business has one corporate website to provide information to clients and to generate leads that require offline interaction to finalize contracts (e.g., phone, mail, point-of-sale). Each subsidiary has its own website, a separate marketing team, and its own Google Ads account.
One subsidiary (auto) also has an app.
Business requirements
The account structure need to address the following requirements:
- Data is owned by a single business entity in one location.
- Data from the corporate site needs to be available for analysis to improve lead generation and content optimization.
- Each subsidiary needs to compartmentalize its data in order for the related marketing team to create audiences, and track conversions associated with a single Google Ads account.
Google Analytics Standard account structure
- Account: One account. Data is owned by a single legal entity.
- Property: One property for each logical user base (corporate site; each subsidiary's site and app).
- Data streams: One data stream for the corporate website. One data stream for each subsidiary site, and one for each corresponding version of the app.
Google Analytics 360 account structure
- Account: One account. Data is owned by a single legal entity.
- Property: One property for all sites and apps (corporate site; each subsidiary's site and app).
- Subproperties: One subproperty for each for each logical user base (corporate site; each subsidiary's site and app).
- Data streams: One data stream for the corporate website. One data stream for each subsidiary site, and one for each corresponding version of the app.
Principles applied
| Structure |
Rationale |
|
One Analytics account.
If there's an existing Analytics account, there's no need to create a new one.
|
Data is owned by a single business entity in one location.
|
|
One Google Analytics 4 property with one (web) data stream for the corporate website (standard account)
|
A single property and data stream for the corporate website makes that data available for analysis to improve lead generation and content optimization.
|
|
For each subsidiary website: (standard account)
One Google Analytics 4 property with one (web) data stream.
The auto-insurance subsidiary property also needs an (Android app) data stream.
|
A single property and data stream for each subsidiary site keeps each site's data separate from the others.
The auto-insurance subsidiary’s app and web data will be available in the same property.
|
|
One Google Analytics 4 property with one (web) data stream for all the websites (corporate and subsidiary). (360)
|
A single source property and data stream for all websites makes that data available for analysis to improve lead generation and content optimization. It also allows for subproperties to be built off the source property. |
|
Subproperties for each subsidiary and the corporate website
|
A subproperty can be created to filter each logical combination of data (corporate website or subsidiary site) into its own view of data.
|
|
One Firebase project for the auto-insurance subsidiary's Android app.
The Firebase project is linked to the auto-insurance subsidiary's property (standard account) or source property (360 account).
|
A Firebase project for the auto-insurance app creates a separate environment for app development.
Linking the Firebase project to the auto-insurance property makes the app and web data available in the same property (likewise for the source property for 360 accounts).
|
|
The corresponding Google Ads accounts and subsidiary properties (standard accounts) or subproperties (360 accounts) are linked.
|
With the Google Ads account for each subsidiary linked to the corresponding property, audiences from the properties are available in the relevant Google Ads accounts, and key event data from the Google Ads accounts is available in the relevant Google Analytics 4 properties.
|
Travel company with multiple brands operating in multiple countries
This company has multiple brands, each with a desktop website, a mobile site, and an app. Each brand has its own marketing team and advertising accounts.
Business requirements
The account structure needs to address the following requirements:
- Data needs to be analyzed by country.
- Each marketing team needs to build its own audiences and attribute key events to its linked advertising accounts.
Google Analytics Standard account structure
- Account: One account. Data is owned by a single legal entity.
- Property: One property for each logical user base (corporate site; each brand's site and app).
- Data streams: One data stream for the corporate website. One data stream for each brand site, and one for each corresponding version of the app.
Google Analytics 360 account structure
- Account: One account. Data is owned by a single legal entity.
- Property: One property for each logical user base (corporate site; each brand's site and app).
- Roll-up property: One roll-up property to view all entity and geographical data sets together.
- Data streams: One data stream for the corporate website. One data stream for each brand site, and one for each corresponding version of the app.
Principles applied
| Structure |
Rationale |
|
One Analytics account.
If there's an existing Analytics account, there's no need to create a new one.
|
Data is owned by a single business entity.
|
|
One Google Analytics 4 property per brand, each with:
- One (web) data stream for the brand’s website
- One (app) data stream for each version of the brand’s app (Android, iOS)
|
One property per brand allows for:
- Analysis by brand and country
- Building audiences from a brand-specific and country-specific user base
- Attributing key events to the linked advertising accounts
Individual data streams for each platform allow for all-inclusive, comparative, or individual analysis of data, and for building platform-centric audiences.
|
|
One roll-up property bringing all brand properties together in one place (360 accounts)
|
A single roll-up property with all source properties included allows for a holistic view of the data at the institution level.
|
|
The brand-specific Google Ads, Display & Video 360, and Search Ads 360 accounts are linked to the relevant properties.
|
Each marketing team needs to build its own audiences and attribute key events to linked ads accounts.
|
Extended guide and reference
The remainder of this guide provides detailed information for businesses whose needs extend beyond the examples in the section above. This extended guide is particularly relevant if you are a Google Analytics 360 customer.
Concepts and definitions
If you’re learning about Google Analytics 4 properties, you may find these articles and videos helpful:
- Account: A collection of properties whose data is owned by a single legal entity and governed by region-specific terms of service (TOS).
Is it important that the data from each region is owned by a distinct legal entity within that region?
- Yes: Create multiple accounts, one for each region.
- No: Create one account in the region that houses your company headquarters.
- Property: Lives within an account, and represents data for one user base. If data should generally be analyzed together (product line, brand, application), data should be in one property (which can act as a source property if you have Google Analytics 360.)
Is the data you collect related to a single logical user base? When you link Analytics to other products, do you want to share that entire body of data with each product?
- Yes: Create one property.
- No: Create a separate property or subproperty for each logical user base.
- Data stream: Lives within a property, and is the source of data from an app or website. The best practice is to use a maximum of 3 data streams per property: 1 single web data stream to measure the web user journey and 1 app data stream each for iOS and Android.
- App data stream: You can have one data stream for each combination of app-package name and platform.
- Web data stream: In most cases, you should use a single web data stream to measure the web user journey. To ensure consistent user and session reporting for web journeys that span domains, use a single web data stream combined with cross domain measurement.
Best practices
The following best practices and recommendations are meant to cover a wide range of users and use cases. There may be edge cases where this guidance does not apply or needs to be adapted to specific circumstances.
In general, you should set up one account per company and one property per brand or business unit (assuming your brands and business units are unique/distinct operating entities with separate stakeholders/analyst groups).
Example A
- Parent Company A: 1 account
- Brand X (automotive): 1 property
- Brand Y (household goods): 1 property
- Brand Z (consumer electronics): 1 property
In this case, the parent company has one account and three distinct properties, with each property containing data related only to that brand/business.
Example B
- Enterprise company B: 1 account
- Product line D (home insurance): 1 property
- Product line E (car insurance): same property as D
- Product line F (life insurance): same property as D & E
In this case, the enterprise has chosen to have all lines of business send their data into a single property. They may have customers that regularly use multiple products, or often use upsell or cross-sell campaigns between products, so it makes sense to see all of that data together. This property can act as a source property to subproperties for individual product line analysis (see below).
Example C
- Small business C (ex. Joe’s deli): 1 account
- All products (deli meats, sandwiches, beverages, etc): 1 property
In this example, Joe's deli is a small business and doesn't need multiple properties. They analyze all of their data together for their online deli delivery business, since customers often buy more than one product and Joe's deli doesn't have different lines of business. A single property for all of their data makes sense.
Data streams
Each source property has streams of data from an app and/or website providing incoming data. A data stream is therefore simply a website or app sending data to a specific GA4 property.
We recommend:
- 1 web data stream per property
- 1 iOS data stream per property
- 1 Android data stream per property
Each app data stream can only be linked to one GA4 property, so consider this as you decide which streams to link to a property.
Search Console integration
You can link a GA4 property to Search Console. This brings rich new data into Google Analytics, such as Search Queries from Organic Google Search, and dimensions for reporting, such as Landing Page.
You need to decide which property should be linked to which Search Console property. If you are using subproperties and roll-up properties, you'll need to choose whether to link to the source property, subproperty, or roll-up property.
Setting up the link between your GA4 property and your Search Console property is a quick and straightforward process that can be done in the GA4 Admin page. Note that you will need to be a verified site administrator on the Search Console property and have the Administrator role on the Google Analytics 4 property to set up the link.
Customize what reports are visible
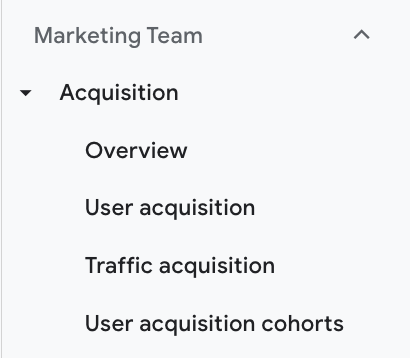
Google Analytics 4 properties give you full control over what reports to show, the metrics and dimensions included in those reports, and the graphs within your reports. You can set up an entire report collection that is relevant to just a certain group, for example, the Marketing team (but note, you cannot restrict access to these collections; all property users will be able to see them). This allows you to customize GA4 so that the most relevant reports are the first that you see or the easiest to access, without having to wade through reports that you may not need.
Example of Marketing Team report collection:
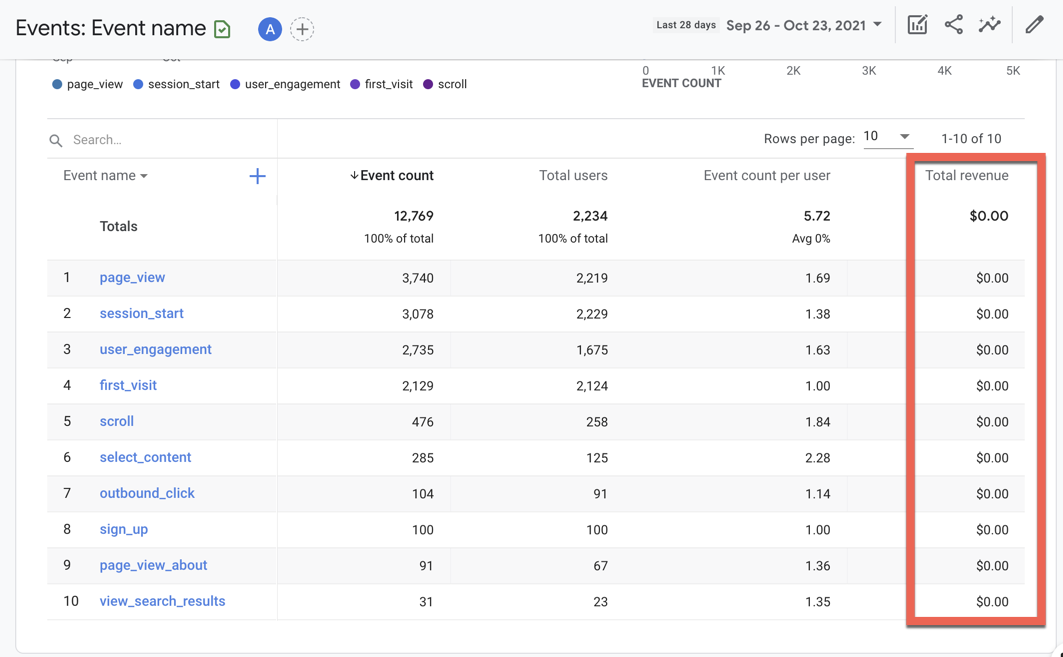
You can customize the specific reports within each collection. For example, most table reports have a “Total Revenue” metric that shows up in the standard report configuration. This is great if you are an ecommerce business sending revenue data and you want your teams to be able to analyze this. However if you do not have revenue data to report within Google Analytics, this column will show a $0.00 value for every row. If it’s not a relevant metric for your business, you can remove it and declutter your reports.
Events report with Total Revenue metric:
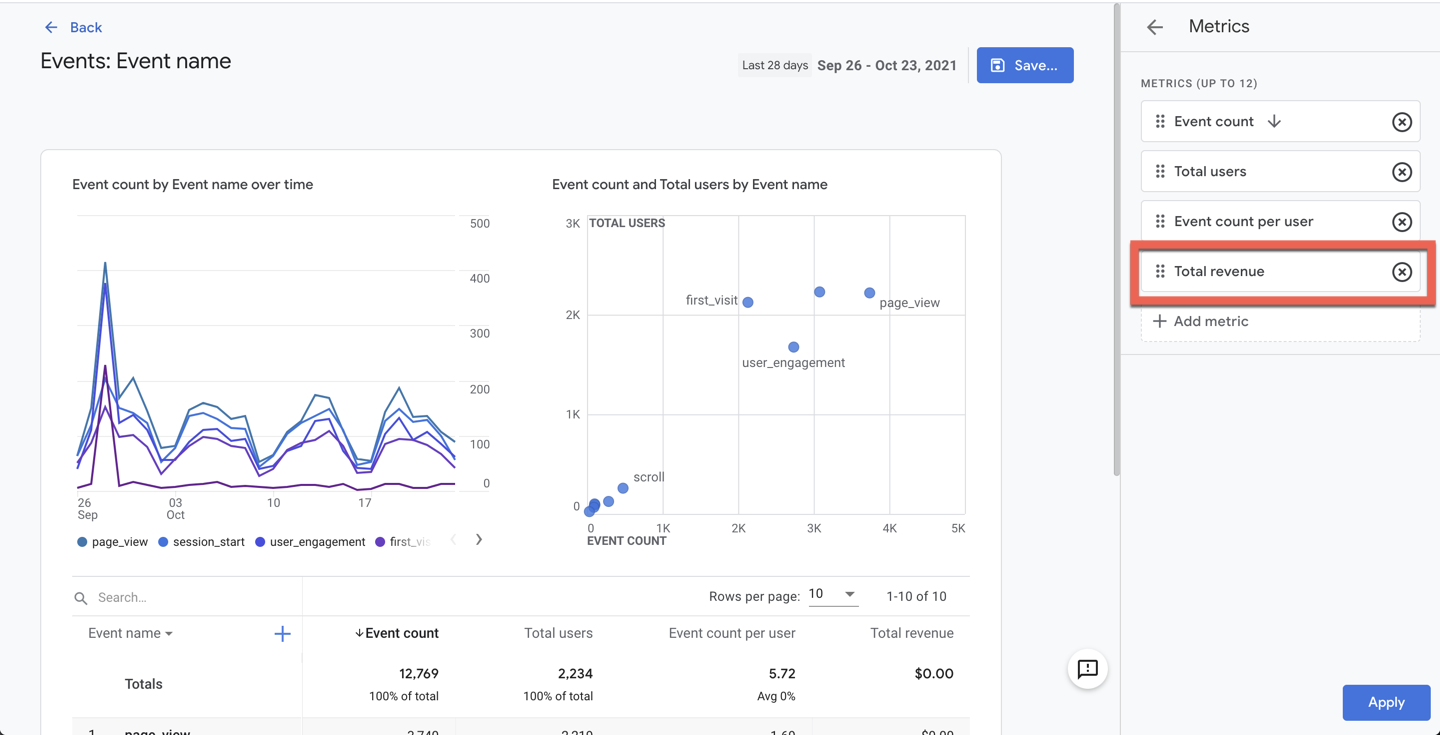
Edit interface (click the “X” next to the metric to remove):
Apply and save without “Total Revenue” metric:
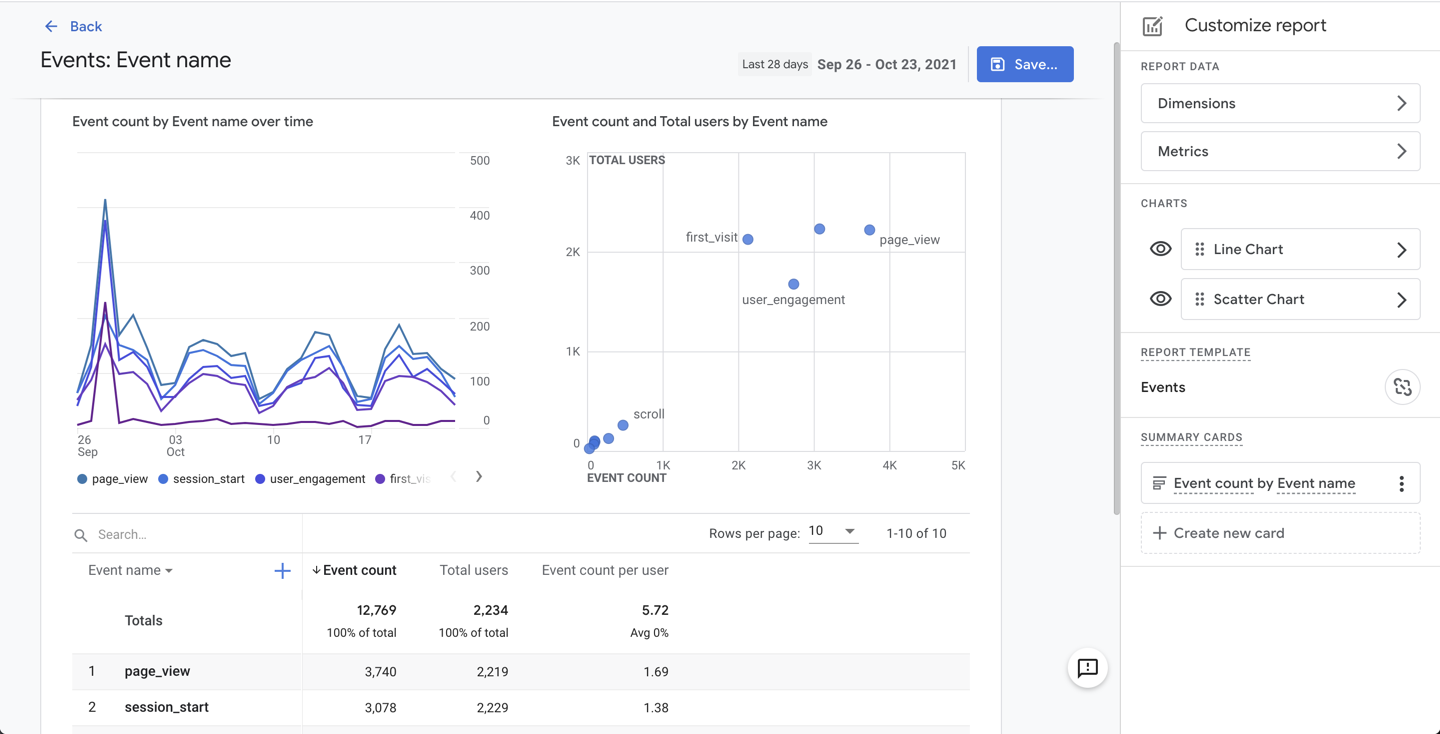
This report is now much cleaner for a business that does not have (or does not want to show) revenue data within Google Analytics.
Data-hygiene best practices
In addition to filtering your reports to include or exclude certain data, pay close attention to data hygiene, which includes excluding internal IP traffic, excluding unwanted referrals, and ensuring cross-domain measurement is properly set up.
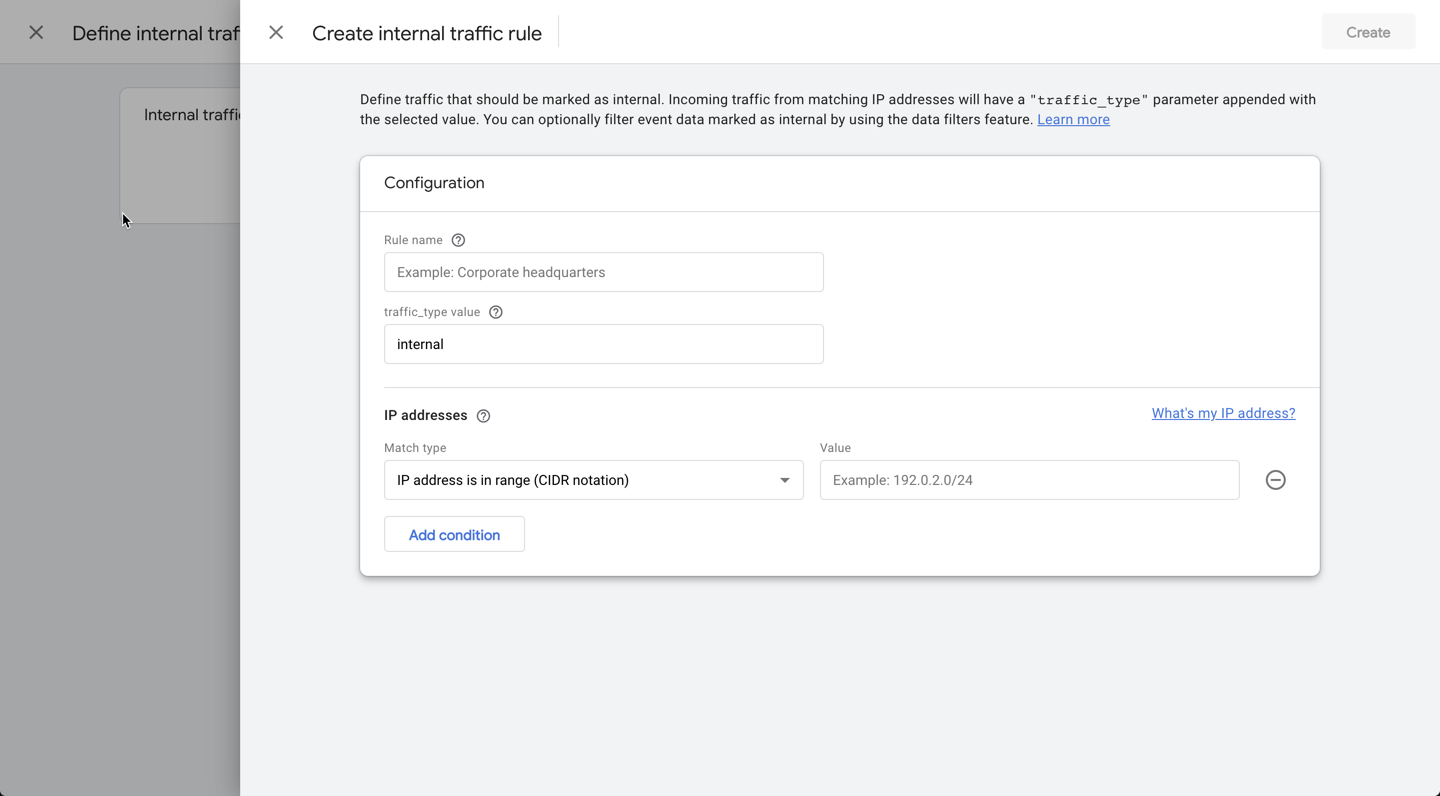
Exclude internal IP traffic
Removing internal IP traffic from your data sets can be an important set up step for many businesses who see a lot of employee traffic on their website, for example, a support technician who often references help center articles from their companies website while working with a customer. This ensures that your company employees (internal users) are not skewing your analytics data meant to report on external customer use cases. This is now a preset filter in GA4:
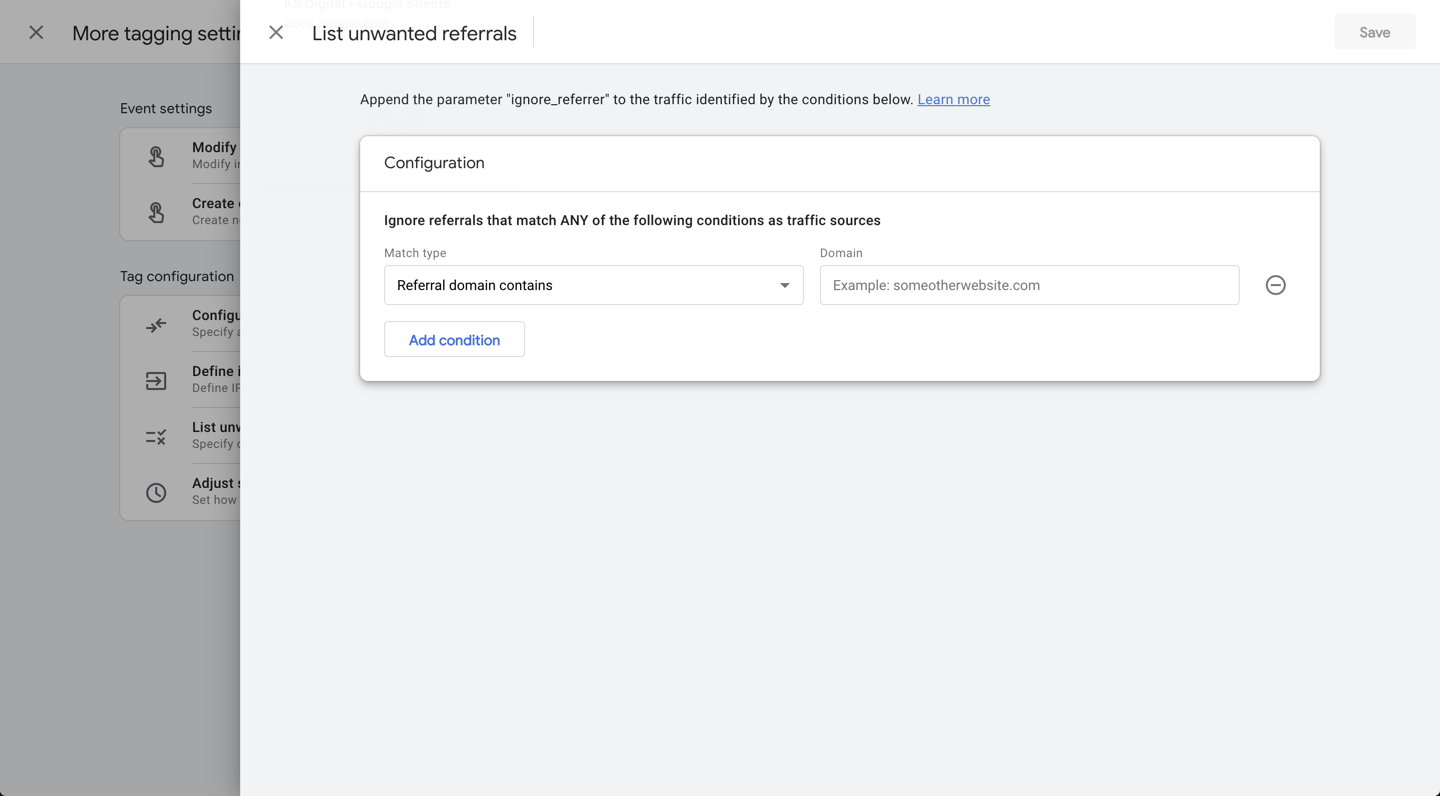
Remove unwanted referrals
Another aspect of data-hygiene best practices to consider is excluding unwanted referral traffic. This allows you to keep data from certain referral sources out of your production data by keeping the event, but ignoring the referrer so the traffic attribution is unaffected. Again, this is now a predefined configuration in GA4:
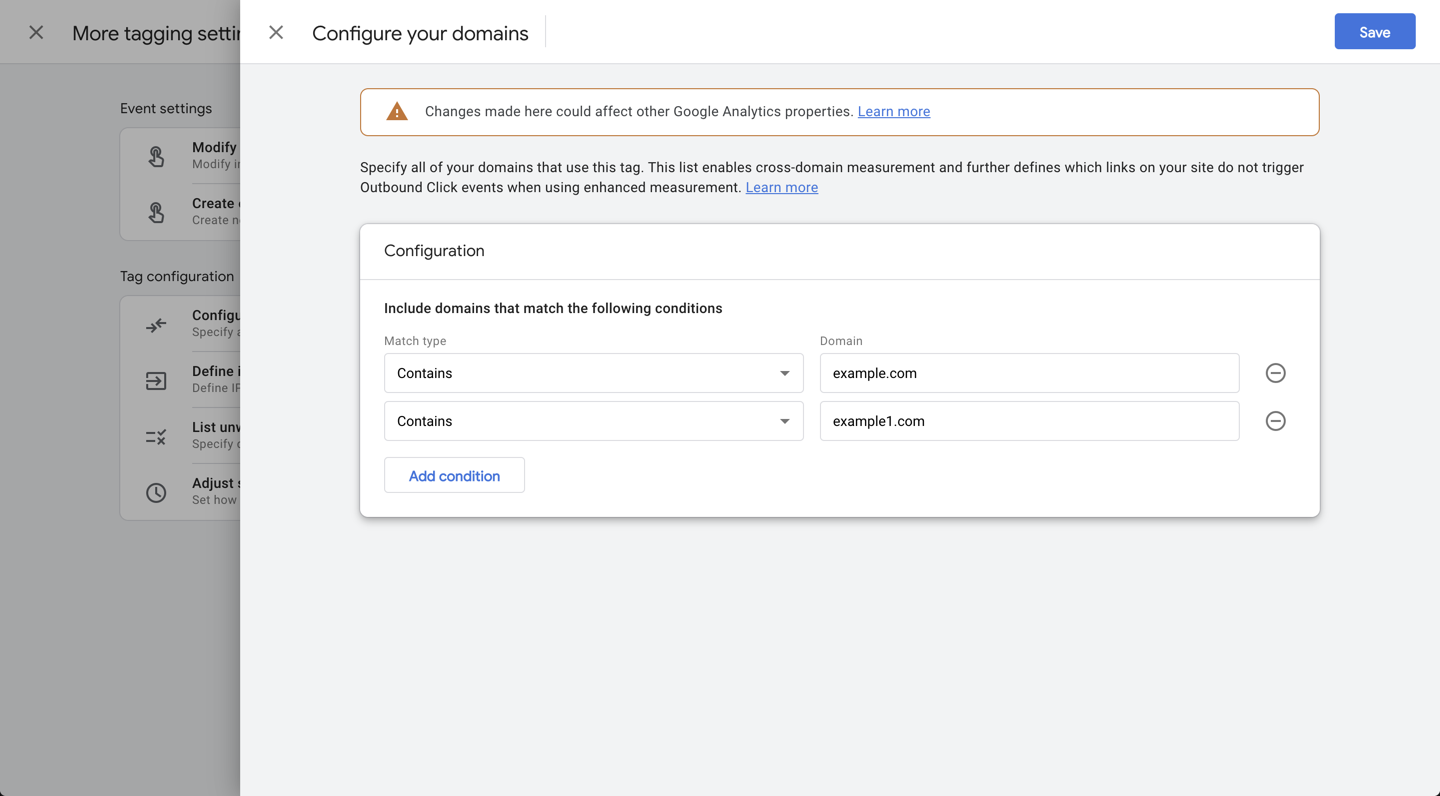
Set up cross-domain measurement
Lastly, a common issue for Google Analytics users has always been dealing with cross-domain traffic. Previously, you would have to set up cross-domain measurement either through Google Tag Manager or your TMS, or by hard coding it on your site. This required extra effort that was not always achievable for Google Analytics users, and thus often led to data hygiene issues showing new or inflated session count and referrals from your own owned domains. Google Analytics 4 makes this easy to set up within the user interface to help improve your data hygiene:
Data transformations can be handled through event creation and modification in Google Analytics 4 properties.
For example, let’s say that you discover that a certain event has been sent to your GA4 property twice, but in two different ways. Maybe the “start_now” event that leads to a key action on your website is being sent to GA4 in multiple ways (“start_now” and “startNow”) because it appears in several different places on your website that were developed by different teams that unknowingly coded things differently. This is a common scenario that can impact your data quality, however you can now correct this by creating and modifying events in the user interface.
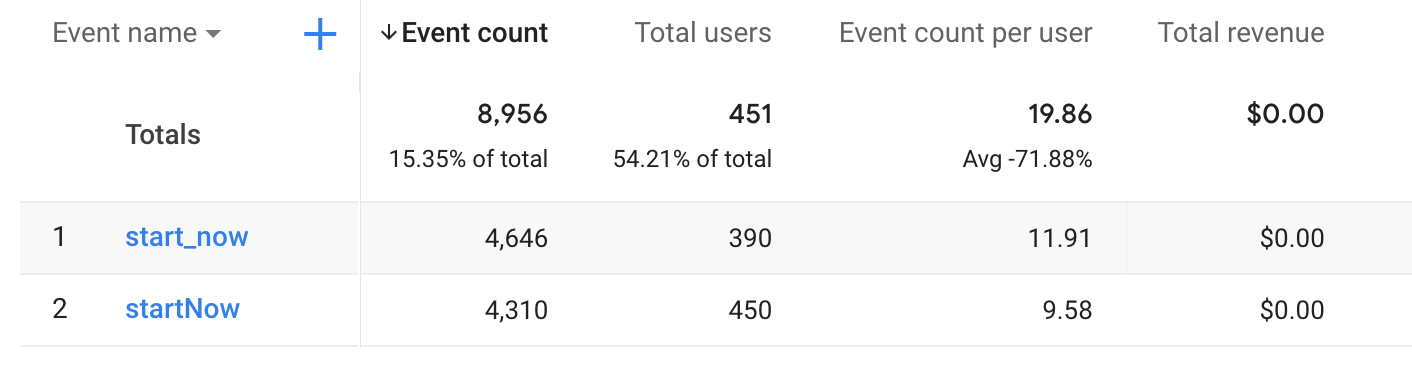
To fix this issue, click Modify event in the Configure section of your GA4 property.
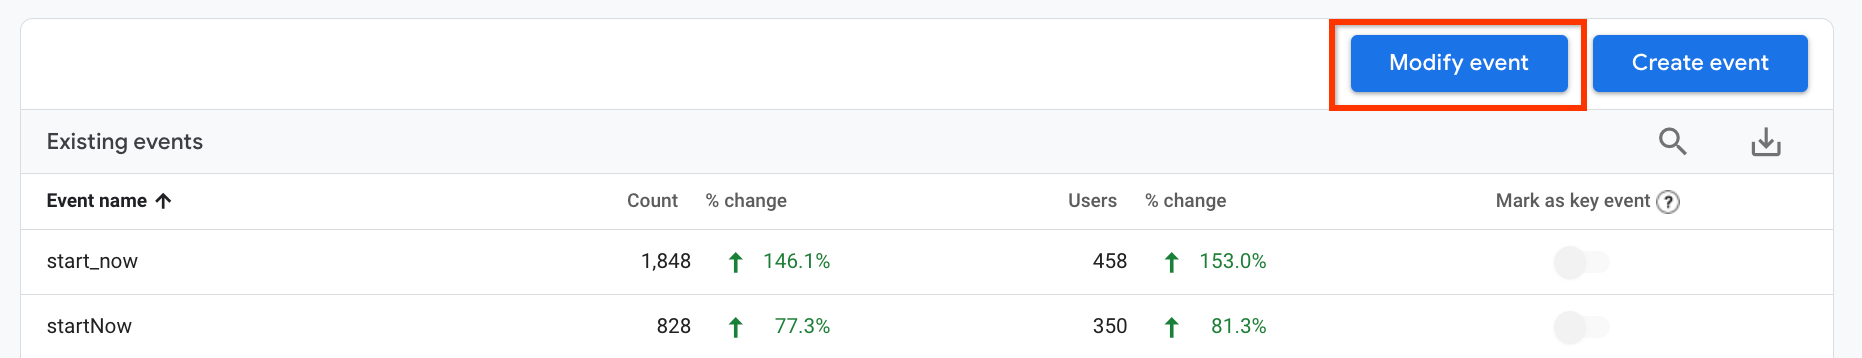
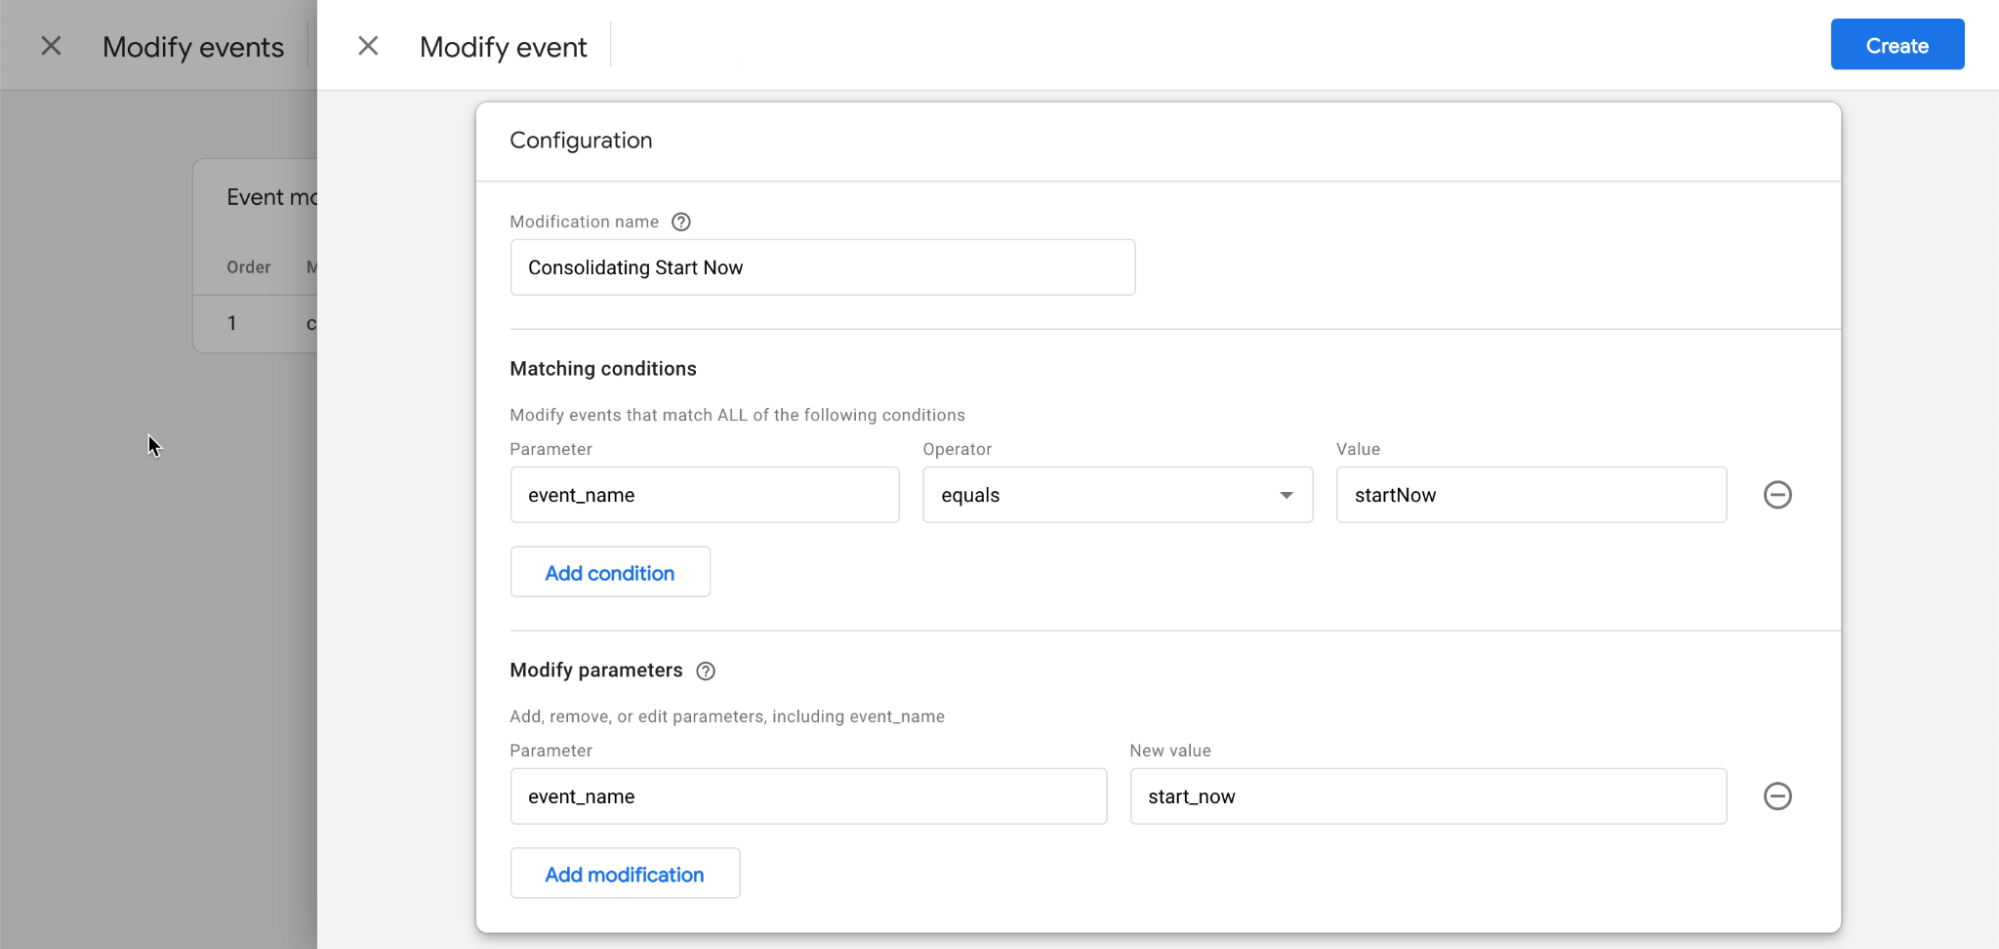
You’ll get to this screen where you can specify the changes you want to make. In this case, you’ll choose which Start Now event you want to keep, and choose to modify the other to match it. The example below shows that any event with the name “startNow” will be modified to instead have the event name of “start_now”. This will consolidate these two event names into a single name going forward; your reports will look much cleaner with a single row for this event.
User permissions and user roles
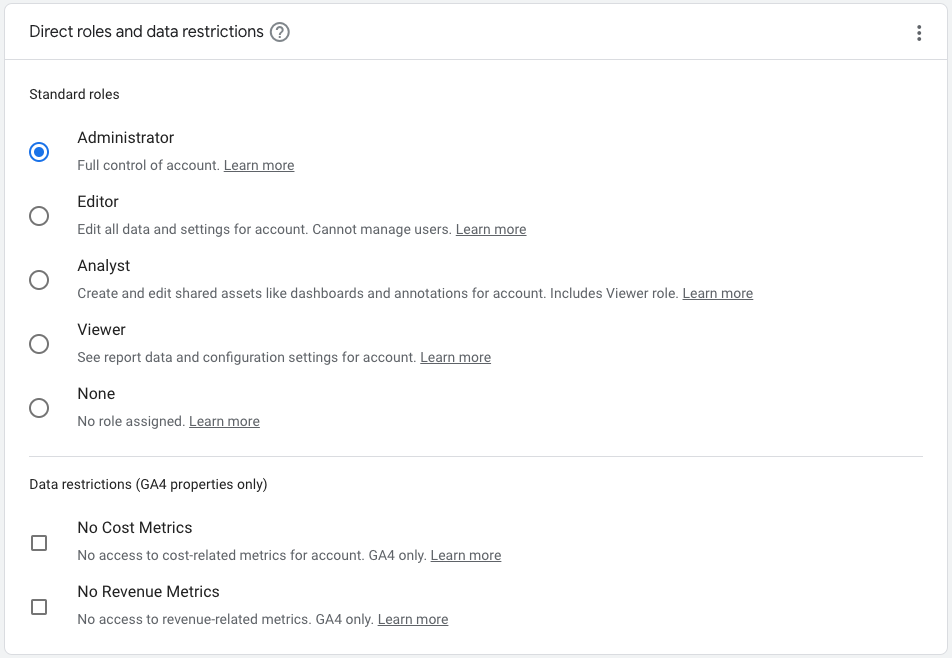
Google Analytics 4 properties introduce streamlined and smarter roles and restrictions functionality. Standard roles now include the following:
- Administrator: someone with full control of the account
- Editor: someone who has full edit access to data and settings but cannot manage users
- Analyst: someone who can create and edit shared assets in addition to viewing data and configurations
- Viewer: someone who can see report data and configuration settings
Additionally, GA4 properties add the ability to hide cost and revenue data within the reporting interface based on an assigned data restriction role of “No Cost Metrics” or “No Revenue Metrics”. This is a useful addition to user permissions to help protect sensitive business data while allowing access to site and behavioral data to certain audiences.
Note about cost and revenue restrictions: Metric filters will not work on an audience that shows revenue data. Additionally, users with these restrictions will still be able to see purchase event counts. So, if you are concerned about seeing event counts for purchase data, you will need to consider a subproperty for this use case.
360-specific features: subproperties and roll-up properties
Subproperties
Subproperties are a new kind of Google Analytics 4 property available to Google Analytics 360 accounts. They allow you to create a subset of the data that’s in a source property. Subproperties replace the need for views. For example, you can create a subproperty that has a subset of the data that’s in your source property, and provide certain users with access to just that subproperty. In addition, subproperties provide capabilities around data hygiene, data governance, user governance, and feature governance that significantly increase the benefit of using GA4 for larger businesses and enterprises.
You can create a subproperty from any source property, but cannot create a subproperty from a roll-up property. Subproperties have a one-to-one relationship with a source property.
Subproperties incur an additional cost for 360 customers. See
Cost considerations, below, for more information.
Data governance
One of the biggest use cases for subproperties is data governance - controlling what data is included or excluded from a property. Subproperties allow you to filter data in or out in order to create the set of data needed for a specific audience or use case. This allows for better organization of your data to make it more easily accessible to certain audiences.
Separating data sets allows for each group to access their information more quickly and easily, even if they could have achieved the same thing with a little more filtering in the source property. Subproperties allow you to achieve this with import and export filters from a source property to a subproperty for these types of use cases.
Data can be filtered into a subproperty using any event or custom dimension collected in the source property.
User governance
Another use case for subproperties is for user governance needs. An example of this would be if you have strict company policies stating that one region (for example, North America) can see a certain subset of data related to their region, but another region (for example, South America) should not have any access to the data. Using subproperties, you can restrict data for each region within its own property so that there is no access outside of the appropriate region.
This line of thinking similarly applies to lines of business that need to keep their data separate for their own operating needs, or separate data between the marketing site and the in-product experience, if your company has reasons that one team should not see the data of another team.
If you do not need to restrict access to data, but instead just need to point a certain subset of users to certain data sets, report customization and report collections may be a better solution. For example, you could create a collection of reports specifically tailored to the marketing team so they can more easily navigate to the data relevant to them. These features help to organize data in an easy-to-access format for specific audiences and come at no additional cost.
Roll-up properties
A roll-up property contains data from two or more properties. A roll-up property can include data from ordinary properties and subproperties, but not other roll-up properties. They enable a broader view of a business across products, brands, or regions by bringing together data from multiple properties within the same account. Roll-up properties in GA4 support similar use cases.
Roll-up properties function in much the same way as any other property. Each roll-up property has its own quota for custom dimensions, custom metrics, user properties, and more. All settings are controlled from within the roll-up property (roll-up properties do not inherit settings from their source properties), and are specific to the needs of the roll-up property and roll-up user base.
Roll-up properties incur an additional cost for 360 customers. See
Cost considerations, below, for more information.
Cost considerations
Each event that is sent to a subproperty or a roll-up property is processed again, which incurs an additional cost to the 360 account. Each additional event hit is charged at half the rate of the initial event hit. In other words, each subproperty or roll-up property hit costs 0.5 of an event hit.
To help you get a better understanding of how your setup may impact your billing, you can use a new feature called “Bill Preview”, available to Google Analytics Certified Partners to help their customers get a better understanding of potential GA4 360 costs.
Examples with subproperties and roll-up properties
If we revisit some of our examples from the beginning of this guide, we can see how these scenarios look from a set-up perspective.
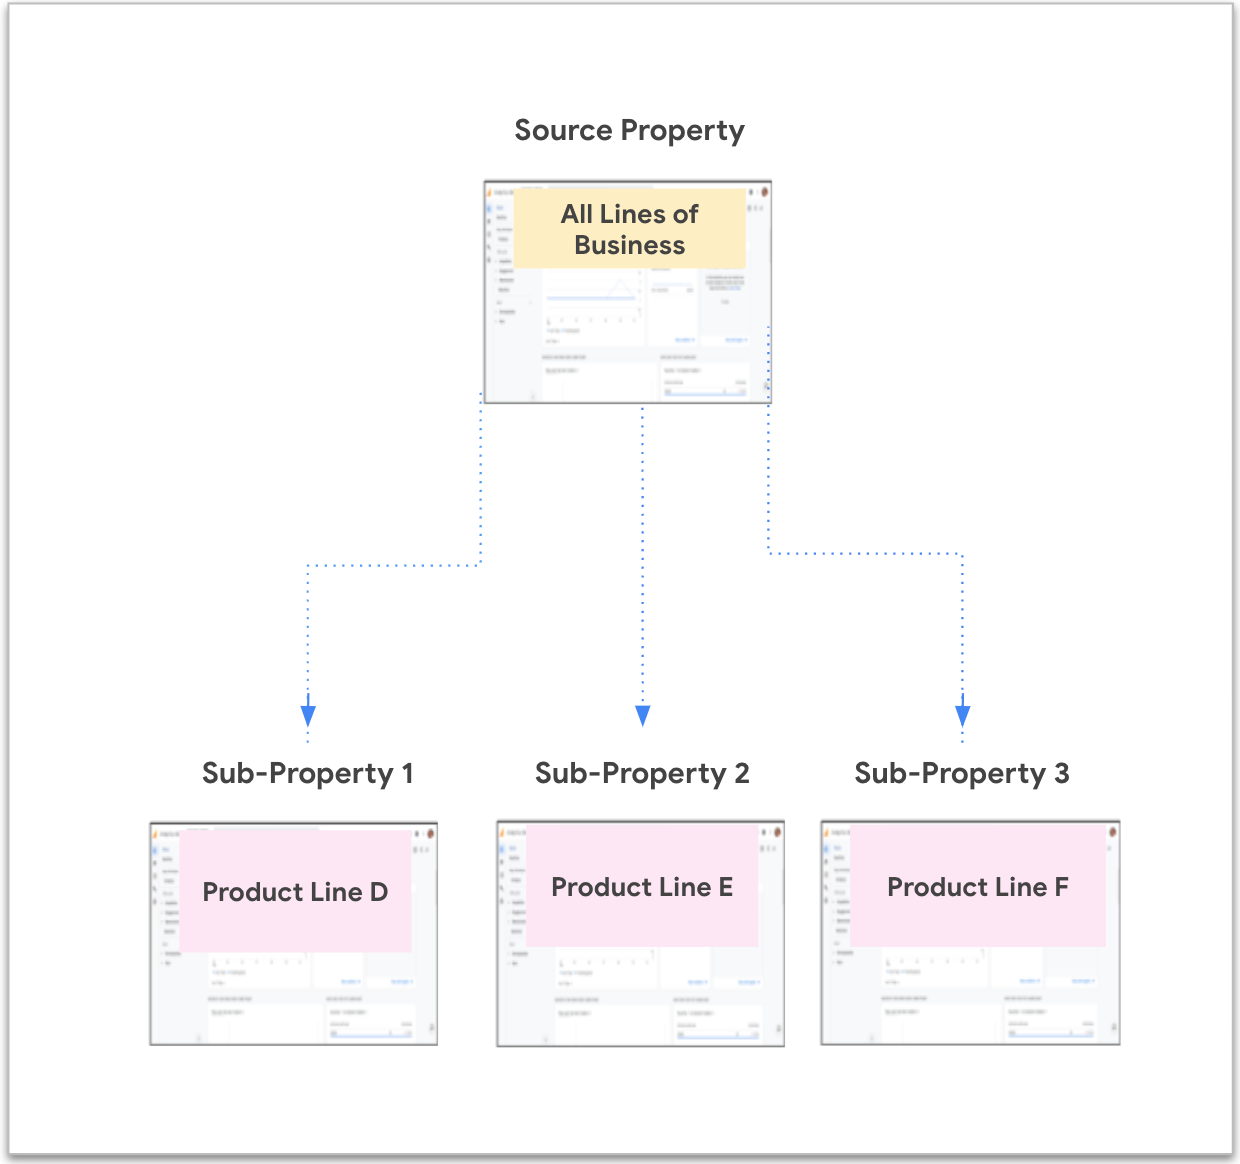
Enterprise company with several complementary lines of business
- Enterprise company B: 1 account
- Product line D (home insurance): 1 property
- Product line E (car insurance): same property as D
- Product line F (life insurance): same property as D & E
In this case, the enterprise company has 1 account with 1 source property. While there are different lines of business which may need to analyze data separately, the products are complementary and there is often a need to analyze multiple products together, so they have decided to send all product data into the same source property. The specific product teams, however, need to be able to analyze their data separately. Due to high volumes of traffic in the overall property, they have elected to create subproperties for each line of business.
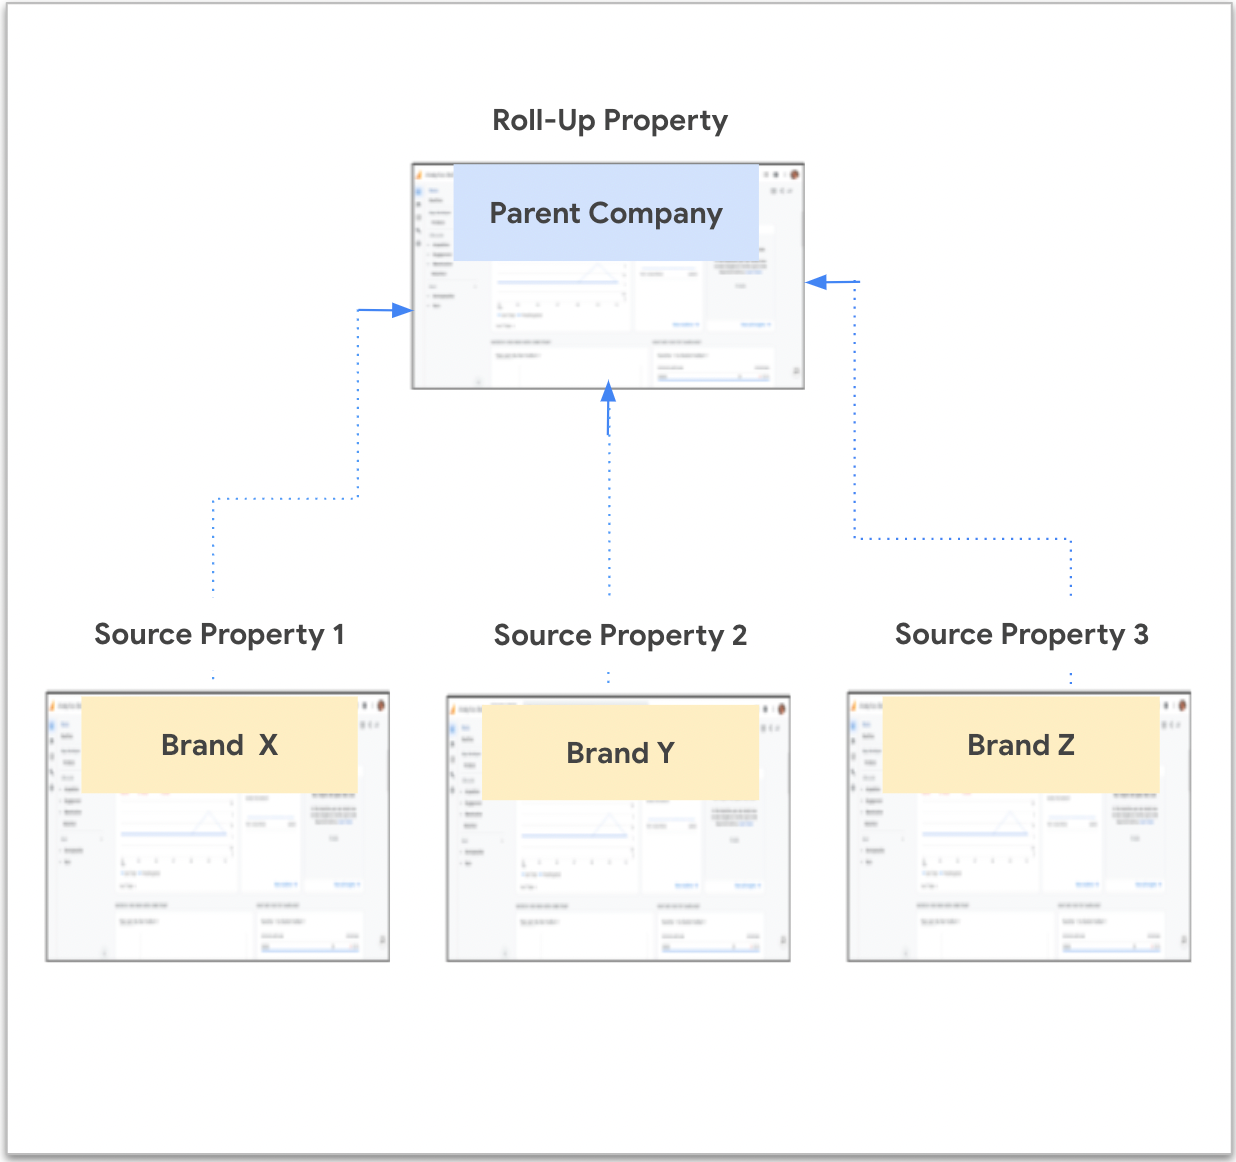
Parent company with several brands
- Parent company: 1 account
- Brand X (automotive): 1 property
- Brand Y (household goods): 1 property
- Brand Z (consumer electronics): 1 property
In this case, the parent company has 1 account with 3 source properties, one for each brand. Each individual brand operates separately and needs to analyze their data separately, so they each have their own source property. The parent company, however, would like to see all of their brands rolled up into a single property so that they can have a good understanding of total users, total revenue, and more. In this case, the parent company will create a roll-up property with all 3 brand properties as sources for the roll-up. This will give them the holistic view they need, while allowing the brands to remain independent from one another.
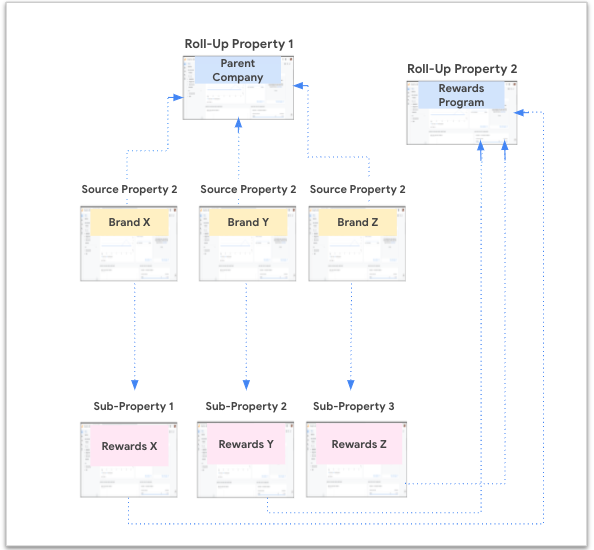
Let’s elaborate on this example. This parent company has a loyalty rewards program that extends across all of their individual brands. When a user participates in this loyalty program, they have a unique rewards ID that we can associate with the user as a user property and/or as a parameter on every event.
The rewards team works at the parent company level, and needs to see data for loyalty program participants across all brands together in the same property. We can achieve this by using a combination of subproperties and roll-up properties so that the rewards team has their own data set to work with. Each source property would produce a subproperty with data just for rewards participants, and then all three subproperties would be pushed into a roll-up property for rewards data.
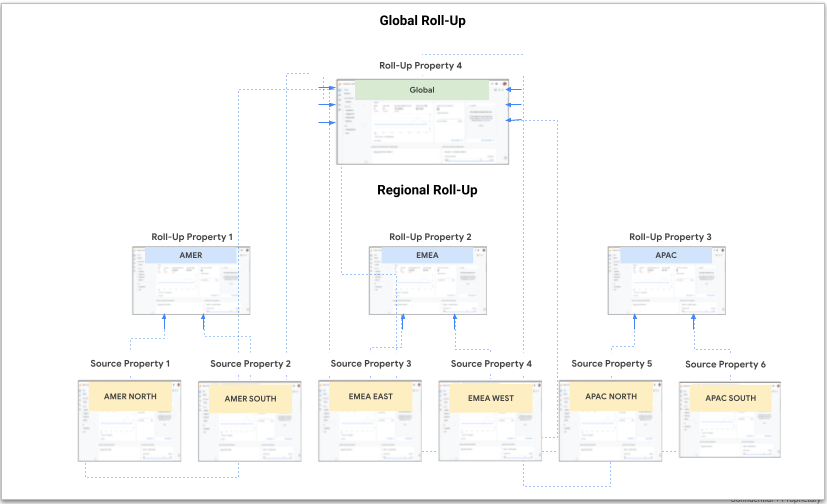
Global enterprise with regions and subregions
In this case, the global enterprise account has 3 regional roll-up subproperties with 2 source subproperties each.
Linking: Google Ads, SA360, and DV360
Google Ads
In Google Analytics 4 properties, there are a few enhancements to Ads linking, however, the premise remains the same. You can link your Google Ads account to your Google Analytics 4 property in order to share audiences and site stats to Google Ads and benefit from Google Ads reporting data in your GA4 property. Linking to an Ads account is at the Google Analytics property level. You can link a source property, a subproperty, or a roll-up property.
In GA4 properties, you share an individual audience with all linked accounts. With this, sharing becomes much easier, but you must share all audiences or none, so keep that in mind as you develop your Google Analytics 4 audiences.
When you link your GA4 property and Google Ads account, you are able to see site stats in Google Ads. This feature exports behavioral engagement data from Google Analytics directly into the Google Ads user interface. While you can set up a link to any property type, we recommend that you only link to either the source property or the subproperty (but not both): this avoids the double counting that would occur if you linked to both a source property and a subproperty.
Audiences can be shared from any GA4 property (i.e. ordinary property, subproperty, or roll-up property) to Google Ads, but keep in mind that an audience from a subproperty or a roll-up will have different data than the source (ordinary) property, due to filtering or multiple data sets. This is important to note when using audience targeting in Google Ads.
Similarly, key events are dependent on the linked property type. You don’t want to import the same key event type from a source property, a subproperty, and a roll-up property, so the best practice recommendation is to link the source GA property to Google Ads and export your key events only from the source. An exception to this may be if you have regional-specific Ads accounts, which you may need to link at the subproperty level instead.
Data brought from Google Ads into a Google Analytics 4 property is done at query time. This ensures that you are always looking at the most up-to-date data and prevents duplication or aggregation across subproperties and roll-ups.
Search Ads 360
At its initial launch, the SA360 integration will support data inheritance from the source property to a subproperty or a roll-up property. This means that if the link is established on the source property, the subproperty or roll-up property will receive data from SA360, but the subproperty or roll-up cannot control or set up the link itself.
In Google Analytics 4 properties, you will share an individual audience with all linked accounts. With this, sharing becomes much easier, but you must share all audiences or none. Keep this in mind as you develop your Google Analytics 4 audiences.
Display and Video 360
At its initial launch, the DV360 integration supports data inheritance from the source property to a subproperty or a roll-up property. This means that if the link is established on the source property, the subproperty or roll-up property will receive data from DV360, but the subproperty or roll-up cannot control or setup the link itself.
In Google Analytics 4 properties, you share an individual audience with all linked accounts. With this, sharing becomes much easier, but you must share all audiences or none. Keep this in mind as you develop your Google Analytics 4 audiences.