Anhand von Informationen zur Zusammensetzung Ihrer Zielgruppe hinsichtlich Geschlecht, Alter und Interessen können Sie Creative-Content besser anpassen und Ihre Mediaeinkäufe besser planen. Zudem lassen sich so geeignete Zielgruppen für Marketing- und Remarketing-Kampagnen ermitteln.
Berichte zu demografischen Merkmalen und Interessen abrufen
So rufen Sie Berichte zu demografischen Merkmalen und Interessen ab:
- Melden Sie sich in Google Analytics an.
- Rufen Sie die gewünschte Datenansicht auf.
- Öffnen Sie Berichte.
- Rufen Sie Zielgruppe > Demografische Merkmale oder Zielgruppe > Interessen auf.
Zusammensetzung nach Geschlecht, Alter und Interessen
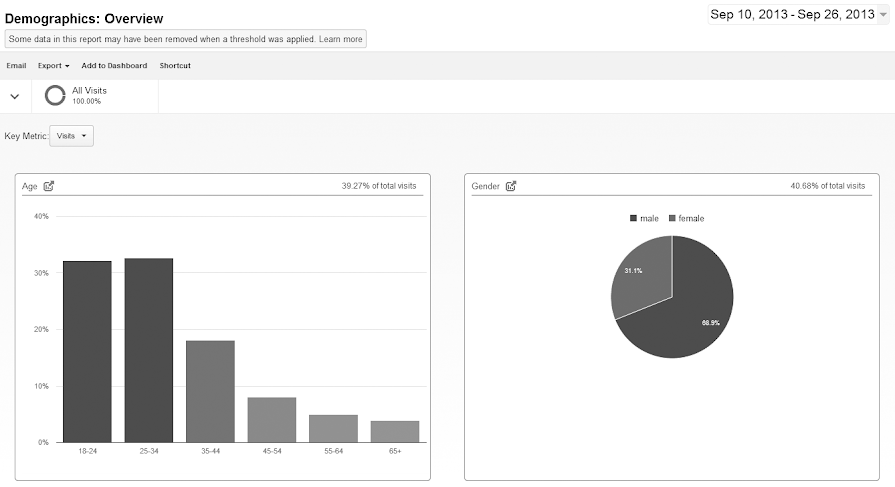
Rufen Sie den Bericht "Demografische Merkmale: Übersicht" auf, um eine nach Geschlecht unterteilte Übersicht über Ihre Zielgruppe zu erhalten. Sie können den Bericht dann weiter aufschlüsseln.
In diesem Beispiel ist
- das Verhältnis der männlichen zu den weiblichen Nutzern 2:1 und
- das Verhältnis der Nutzer in der Altersgruppe der 18- bis 34-Jährigen zu den Nutzern in allen anderen Altersgruppen ebenfalls 2:1.
Wenn Sie Detailinformationen zu "Geschlecht" und dann zu "Männer" abrufen, sehen Sie, dass das Altersverhältnis zwischen den Geschlechtern konsistent ist.

In diesem Beispiel beträgt das Verhältnis der 18- bis 34-jährigen Männer zu allen anderen Männern 2:1.
Rufen Sie die Detailinformationen zu den einzelnen Altersgruppen ab, um sich Daten zur Dimension Sonstige Kategorie anzeigen zu lassen. In diesem Beispiel zeigen die Detailinformationen für die beiden stärksten Altersgruppen, dass "Kunst und Unterhaltung" das Hauptinteresse beider Altersgruppen ist, während auf dem zweiten und dritten Platz jeweils verschiedene Interessen folgen.

Ausrichtung auf umsatzstarke Nutzer
Für die Ausrichtung von Kampagnen und zum Erstellen von Zielgruppen für das Remarketing sollten Sie die demografischen Merkmale umsatzstarker oder potenziell umsatzstarker Kunden identifizieren. Bei einer E-Commerce-Website wäre es hingegen sinnvoll, die Nutzergruppen mit der höchsten E-Commerce-Conversion-Rate oder dem meisten Umsatz zu ermitteln. Wenn Sie eine contentorientierte Website betreiben, kann es sinnvoll sein, die Nutzergruppen mit den höchsten Interaktionswerten zu identifizieren. Dazu stehen Ihnen beispielsweise die Messwerte "Sitzungsdauer" oder "Anzahl an Seitenaufrufen pro Sitzung" bzw. "Bildschirmaufrufe pro Sitzung" zur Verfügung.
Die Berichte zu Alter, Geschlecht und Interessen beinhalten sowohl Messwerte zu Interaktionen als auch zu Conversions. Ausgehend von jedem dieser Berichte können Sie sich ein Bild von Ihren umsatzstarken Kunden machen.
In diesem Beispiel zeigt der Bericht "Alter", dass die Altersgruppen der 18- bis 24-Jährigen und der 25- bis 34-Jährigen zusammen die Mehrheit der Nutzer ausmachen, das Segment der 25- bis 34-Jährigen allerdings den größten Umsatz und die höchste Conversion-Rate aufweisen.

Wenn Sie diese Altersgruppe auf die Zusammensetzung nach Geschlecht hin genauer untersuchen, werden Sie geringere Unterschiede beim Sitzungsvolumen, nämlich nach wie vor 3:1 zugunsten der männlichen Nutzer, aber mit einem Verhältnis von 58:1 weitaus größere Unterschiede beim Umsatz feststellen. Die Conversion-Rate der männlichen im Vergleich zu den weiblichen Nutzern steht im Verhältnis 2:1, der Umsatz pro Transaktion beträgt jedoch 9:1 zugunsten der männlichen Nutzer.
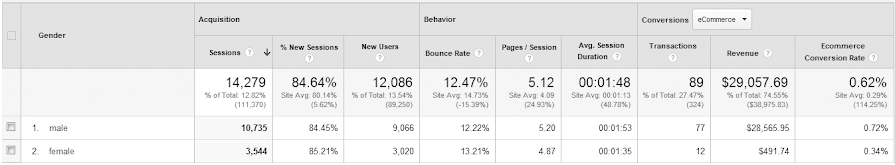
In diesem Beispiel ist also die Gruppe der 25- bis 34-jährigen Männer die umsatzstärkste Kundschaft.
Als Nächstes können Sie die Interessenkategorien mit den meisten Conversions ermitteln. Sie könnten dann z. B. herausfinden, dass Technik-Freaks, Musik- und Fernsehliebhaber, eifrige Nachrichtenleser, Spielefans und Hobbyfotografen gemeinsam die Nutzer darstellen, die den höchsten Umsatz generieren. Sie sollten sich daher auf männliche Nutzer der Altersgruppe 25-34 mit den genannten Interessen konzentrieren.
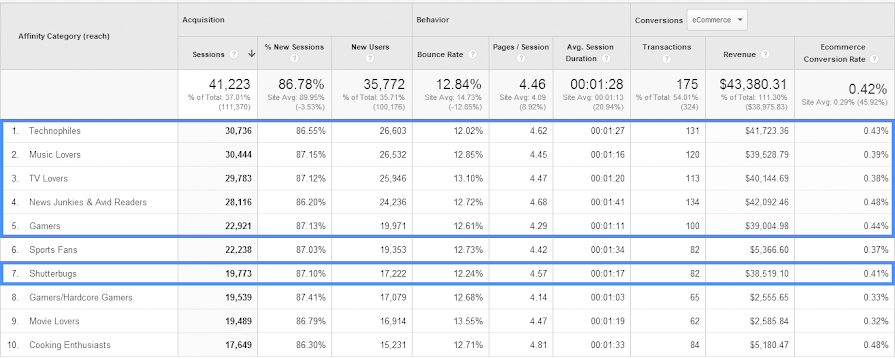
Sie können weitere Informationen zu diesen Kategorien aufrufen, um Ihre Ergebnisse in Bezug auf Alter und Geschlecht näher zu untersuchen. Sehen Sie sich die Detailinformationen zu "Eifrige Nachrichtenleser" genauer an, da in dieser Kategorie der größte Umsatz und die höchste Conversion-Rate erzielt werden.

In diesem Beispiel werden im Segment der 25- bis 34-jährigen eifrigen Nachrichtenleser der höchste Umsatz und die höchste Conversion-Rate erzielt. Um sich eine Aufschlüsselung nach Geschlecht anzusehen, betrachten Sie die Altersgruppe genauer.
Im Einklang mit den vorhergehenden Analyseergebnissen beträgt das Ausgabenverhältnis zwischen Männern und Frauen hier 79:1.
Anhand dieser Daten können Sie Kampagnen ausrichten und Zielgruppen erstellen, die auf Ihre umsatzstärksten demografischen Gruppen zugeschnitten sind.
Werbeausgaben für umsatzschwache Nutzer einstellen
Mithilfe derselben Analyse wie für umsatzstarke Nutzer können Sie auch umsatzschwache Zielgruppen ermitteln: Statt nach hohen Umsätzen und Conversion-Raten zu suchen, sehen Sie sich die Kunden mit niedrigem Umsatz und geringer Conversion-Rate an.
Sobald Sie diese umsatzschwachen Kunden identifiziert haben, können Sie diese Kunden bei der Schaltung Ihrer Anzeigen ausschließen.
Berichte nach Geschäftszweigen segmentieren
In den beiden vorherigen Beispielen wurde beschrieben, wie Sie anhand dieser Berichte Nutzer auf der Makroebene analysieren können. In den nächsten Beispielen wird erläutert, wie Sie Segmente verwenden, um Ihre Nutzer auf Mikroebenen für Ihr Unternehmen zu untersuchen. Hierbei werden Daten aus der Perspektive von E-Commerce-Unternehmen ausgewertet, um zu erfahren, welche Produkte Nutzer kaufen, und aus der Perspektive von Publishern, die Sitzungen analysieren, um zu ermitteln, welcher Content für Nutzer relevant ist.
E-Commerce
Wenn Sie ein E-Commerce-Geschäft betreiben, können Sie Daten nach verschiedenen Dimensionen segmentieren, wie Produkt, Produktkategorie, Produktmarke oder Produkt-Artikelposition (SKU). So lässt sich die demografische Zusammensetzung Ihrer Zielgruppe ermitteln.

Wenden Sie das Segment auf den Bericht "Demografische Merkmale: Übersicht" an.

Sie sehen für den Hauptmesswert Sitzungen, der den Sitzungen entspricht, in denen Nutzer ein bestimmtes Produkt gekauft haben, eine weitere Untergliederung nach Alter und Geschlecht.
Öffnen Sie den Bericht "Demografische Merkmale: Alter", um die zugehörigen Daten zu Akquisition, Verhalten und E-Commerce-Conversions abzurufen.

Wenn Sie dieses eine Segment anwenden, können Sie in den Berichten "Demografische Merkmale" und "Interessen" Nutzer mit hohem und niedrigen Wert für ein bestimmtes Produkt identifizieren.
Publisher
Wenn Sie als Publisher Werbeflächen auf Ihrer Website verkaufen, sollten die Werbetreibenden wissen, welche Nutzer sich Ihre Seiten ansehen und in welchem Umfang. Sie können Seitenaufrufe mit Messwerten wie Sitzungen, Absprungrate, Seiten/Sitzung und Durchschnittl. Sitzungsdauer auswerten.
Wenn Sie beispielsweise eine Website mit Lifestylecontent unterhalten, auf der ein Bereich Lifestyleartikeln wie Taschen und Elektroprodukten gewidmet ist, können Sie ein sitzungsbasiertes Segment erstellen, um die Zugriffe auf diese Seiten isoliert zu betrachten:
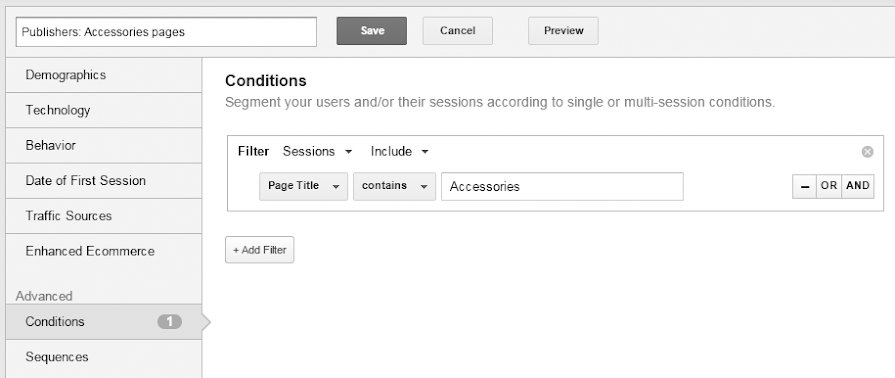
Sie können auch einfach ein Segment erstellen, mit dem die Zugriffe auf ein einzelne Seite isoliert werden.
Wenden Sie das Segment auf den Bericht "Demografische Merkmale: Übersicht" an.
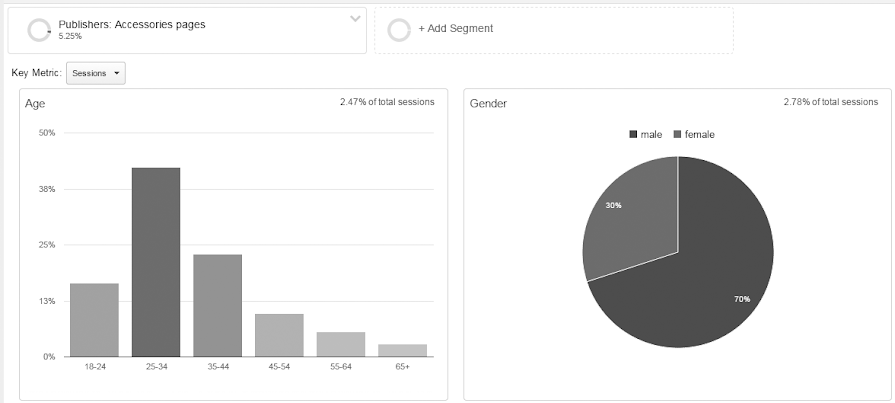
Sie können die Alters- und Geschlechtsstruktur der Nutzer sehen, deren Sitzungen auch diese Seiten umfassen.
Öffnen Sie den Bericht "Demografische Merkmale: Alter", um die zugehörigen Daten zu Akquisition, Verhalten und Ziel-Conversions abzurufen.
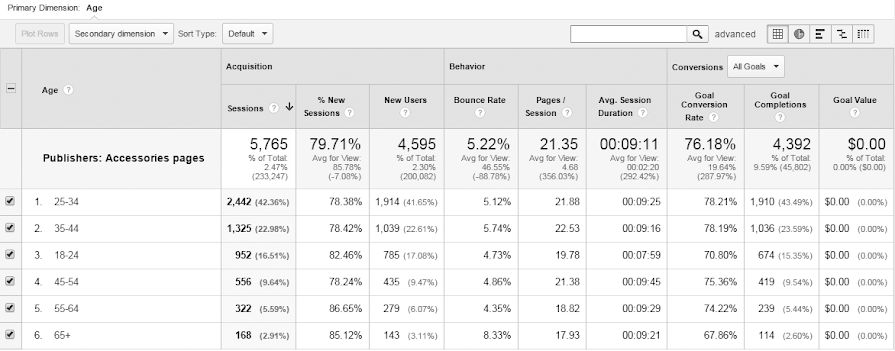
Wenn Sie dieses eine Segment anwenden, können Sie in den Berichten "Demografische Merkmale" und "Interessen" Nutzer mit hohem und niedrigen Wert für bestimmten Content identifizieren.
Remarketing-Zielgruppen optimieren
Als Dimensionen stehen Ihnen Alter, Geschlecht, Kategorie gemeinsamer Interessen, Segmente mit kaufbereiten Zielgruppen und sonstige Kategorien zur Verfügung. Verwenden Sie diese zum Erstellen von Segmenten, auf denen Ihre Remarketing-Zielgruppen in Analytics beruhen.
Anhand der oben genannten Beispiele für Analytics-Berichte können Sie das folgende Segment erstellen, auf dessen Grundlage Sie in Analytics eine Remarketing-Zielgruppe für umsatzstarke Kunden aufbauen können:

Alter "25-34, 35-44"
Kategorie gemeinsamer Interessen: Übereinstimmung mit dem regulären Ausdruck "Technik-Freaks|Musikliebhaber|Fernsehliebhaber|Eifrige Nachrichtenleser|Spielefans|Hobbyfotografen"
Jede Zielgruppe in Analytics-Berichten können Sie als Remarketing-Zielgruppe in Google Ads verwenden.
