Dashboards are a collection of widgets that give you an overview of the reports and metrics you care about most. Dashboards let you monitor many metrics at once, so you can quickly check the health of your accounts or see correlations between different reports. Dashboards are easy to create, customize and share.
In this article:Go to your Dashboards
To access your Dashboards:
- Sign in to Google Analytics.
- Navigate to your view.
- Open Reports.
- Click CUSTOMIZATION > Dashboards.
Dashboard widgets
A widget is a mini-report that can display your data in a number of presentation styles, including simple numeric metrics, tables and charts. You can define widgets within the Dashboard itself. Widgets can also provide snapshots of and link to standard or custom reports.
Click the widget title to open the underlying report.
The Creating Dashboards article describes the widgets and options available to you.
Using Dashboards
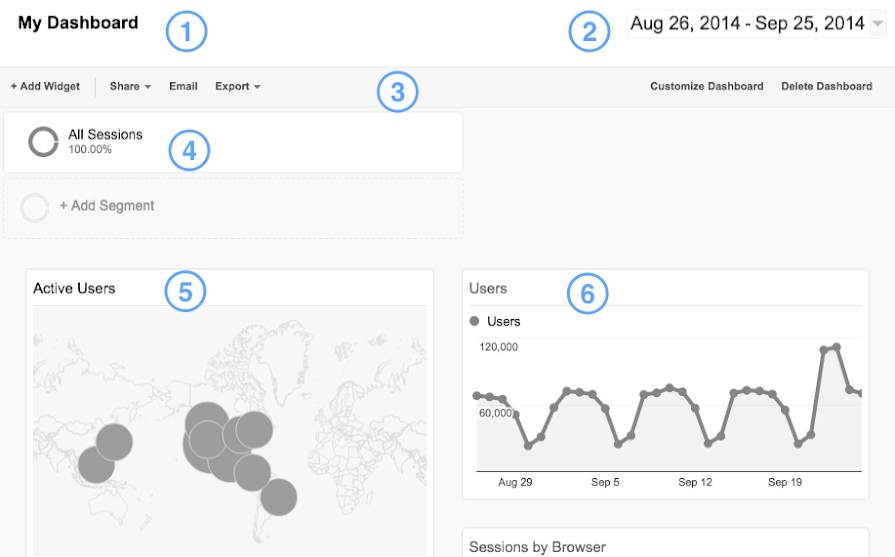
Using a Dashboard is very much like using any report in Analytics. You can examine the graph elements in a widget by hovering over the element. The image below illustrates some other things you can do with Dashboards:
Change the name of a Dashboard by clicking the Dashboard’s title.
Adjust the date range or compare 2 date ranges using the date picker.
Add widgets, share, customize or remove the Dashboard using the action bar.
Add or remove segments.
Rearrange widgets on the page by dragging them by the title bar to new locations. Edit or delete widgets using the controls that appear when you mouse over the widget’s title bar.
Open a linked report by clicking on the widget’s title. (This only works for linked report widgets, not widgets you create within the Dashboard itself.)
- Refresh the Dashboard’s data by clicking the Refresh Dashboard link, located in the bottom right corner of the page (not shown in the screen shot).
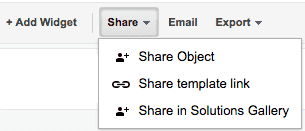
Sharing Dashboards
All Dashboards you create start out as private, meaning only you can see them. You can share Dashboards with other users via the Share menu. You can also share the Dashboards via email or export them to PDF using the Export and Email menu options.