February 21, 2019
We’ve launched two new chart types in the Report Editor: the stacked bar chart and the bubble chart. There are now six total chart types available for your reports:
- Line chart
- Bar chart
- Stacked bar chart
- Pie chart
- Scatter chart
- Bubble chart
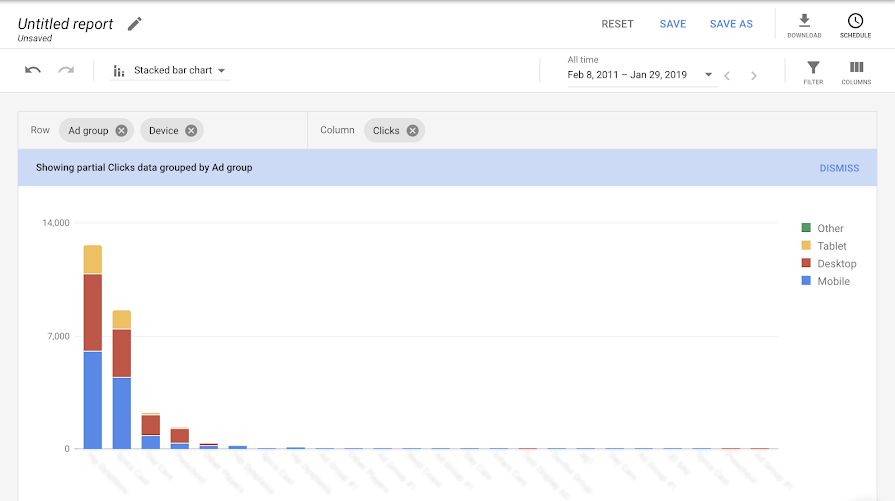
These two new chart types can provide additional ways to interpret your data and glean insights. For example, you can use a stacked bar chart to see how clicks in an ad group breakdown by device and you can evaluate that mix over time. You can use a bubble chart to view clicks, conversions, and cost by campaign in one chart, as the size of the bubble can represent a third metric.
Try these two new charts in your reporting.
Example of stacked bar chart in the Report Editor
Posted by Abhishek Kumar, Product Manager, Google Ads