Use the Google Ads add-on in Google Sheets to save time with report creation.
Let’s say that you’re an advertiser who needs to download your Google Ads data as a CSV so you can join it with your proprietary data to build a report. This requires the frequently downloading and updating of data, a time-consuming, monotonous and error-prone operation.
The Google Ads add-on makes the process quick and easy. With the add-on, you only need to create your report once. You can then easily refresh your data directly in Sheets with a few clicks, which will update linked reports automatically. This prevents the tedious, daily and weekly ritual of downloading, copying and pasting data into your spreadsheets.
And since you can do this in Google Sheets your work is immediately available for collaboration and viewing (with those you choose to share it with).
For example, you might run daily reports to monitor how you’re pacing against your budget goals.
Here’s a view of data that can be pulled via the Google Ads add-on in Google Sheets.
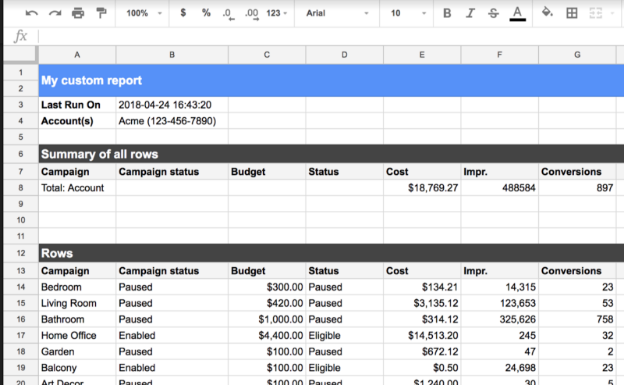
You then use vlookups in a separate tab to join this data with your proprietary spending goals data.
Sumifs (or query functions) and conditional formatting can then be used to represent data more visually in management and client-facing reports, like the one below.

Using the Google Ads add-on feature with sumifs statements or query functions can also make reporting more automated. Some examples include:
- Date range comparison charts. You can implement the add-on across multiple tabs within the same sheet. Let’s say that you want to analyse data comparing two time periods, each with a distinct date range. You can implement the add-on on two separate tabs, each representing a time period. You can then pull the analyses from these two date ranges into a third tab for reporting purposes.
- Roll-up reports. Use importranges to pull data from each report. You can create summary reports that roll up results from many smaller reports.
- Finally, use the add-on to incorporate advanced functions from Google Sheets into your reports. For example, you can use the Open Solver add-on to calculate budget using impression share and performance data.
