Als u uw app aan Firebase koppelt via de Google Analytics voor Firebase SDK, staat het Firebase-overzichtsrapport in het linkernavigatievenster onder de collectie App-ontwikkelaar in Google Analytics. Hetzelfde rapport wordt ook getoond in uw Firebase-console als u links op Dashboard klikt.
Het rapport is een vooraf gemaakt overzichtsrapport met een overzicht van belangrijke gegevens over uw gekoppelde mobiele apps. Zo kunt u het engagement en opbrengst bijhouden en het succes van uw app-releases evalueren.
Het rapport bekijken
- Selecteer Rapporten
in het linkermenu.
- Klik aan de linkerkant op Firebase in de collectie App-ontwikkelaar. De collectie App-ontwikkelaar is alleen beschikbaar als u uw app aan Firebase heeft gekoppeld.
 in het linkermenu.
Kant-en-klare overzichtskaarten
Het overzichtsrapport Firebase bevat standaard deze overzichtskaarten. Beheerders en bewerkers kunnen de kaarten wijzigen, zodat u misschien andere kaarten ziet.
Gebruikersactiviteit in de loop der tijd
Gebruikersactiviteit in de loop der tijd toont het aantal mensen dat uw app in de afgelopen 30 dagen, 7 dagen of 1 dag heeft gebruikt. Op de kaart kunt u wijzigingen in de activiteit in een korter tijdsbestek bekijken in vergelijking met wijzigingen in een langer tijdsbestek. Op de kaart staan alleen gebruikers die interactie met uw app hebben gehad op de voorgrond van uw apparaat.
In het onderstaande diagram ziet u bijvoorbeeld 72.000 gebruikers in de afgelopen 30 dagen en 3500 gebruikers in de afgelopen 24 uur. Als het aantal gebruikers in de afgelopen 24 uur zou dalen, mag u verwachten in de komende 7 en 30 dagen minder gebruikers te zien.

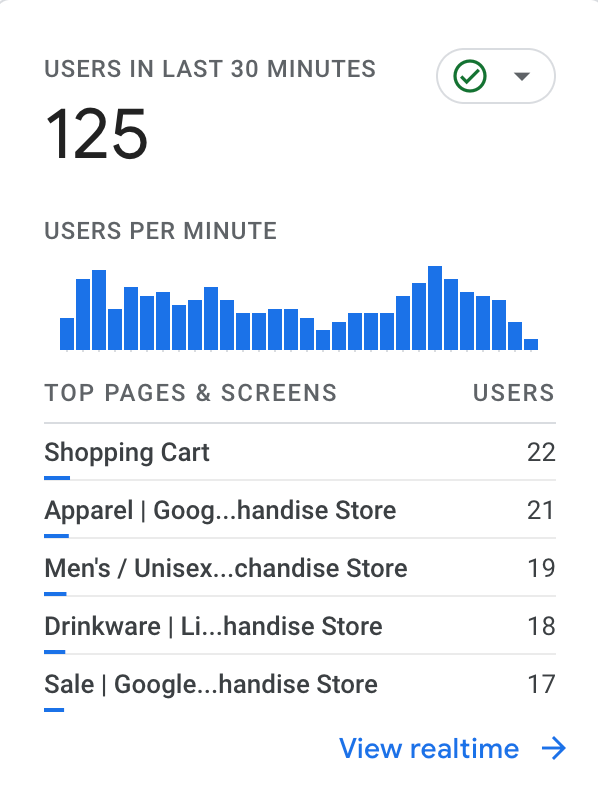
Gebruikers in de afgelopen 30 minuten
De kaart Gebruikers in de afgelopen 30 minuten toont activiteit terwijl die plaatsvindt. Hiervoor worden gegevens uit het Realtime-rapport gebruikt. De eerste helft van de kaart toont het totale aantal gebruikers in de afgelopen 30 minuten en het aantal gebruikers per minuut in de afgelopen 30 minuten.
De tweede helft van de kaart bevat realtime activiteit voor een relevante dimensie. Het overzichtsrapport Engagement kan bijvoorbeeld de populairste pagina's en schermen bevatten die gebruikers op dit moment bezoeken, terwijl in het overzichtsrapport Gebruikerskenmerken de populairste landen worden vermeld waarin gebruikers zich nu bevinden.
Gebruikers per app-versie
Gebruikers per app-versie toont het aantal gebruikers dat interactie heeft met elke versie van uw app, inclusief de 5 apps met de meeste interactie in de opgegeven periode. Klik op App-versies bekijken om het rapport Technische gegevens te openen voor meer informatie over elke app-versie.

Overzicht van de nieuwste app-releases
In het overzicht van de nieuwste app-release staat de status van de nieuwste release van elke versie (bijv. Android, iOS) van uw app. U kunt een versie selecteren om het onderstaande dashboard met inzichten over de app te openen. Daar vindt u inzichten in de app. Ontdek meer informatie over het rapport.

Overzicht van app-stabiliteit
Overzicht van app-stabiliteit toont het percentage gebruikers dat sessies zonder crashes heeft voor elke app en de veranderingen in de afgelopen periode.
Excepties die via de Reporting API van Firebase Crash Reporting worden geregistreerd in logboeken voor Android, tellen mee als crashes. Update naar Firebase Crashlytics voor nauwkeurigere crashrapportage.

Gemiddelde engagementduur
- Op 2 juli heeft gebruiker 1 uw website 3 minuten bezocht.
- Op 3 juli heeft gebruiker 2 uw website 4 minuten bezocht.
- Op 4 juli heeft gebruiker 1 uw website 5 minuten bezocht en heeft gebruiker 2 uw website 6 minuten bezocht.
In dit voorbeeld is de gemiddelde engagementduur op het tabblad 9m 00s, omdat gebruiker 1 de site in juli in totaal 8 minuten heeft bezocht en gebruiker 2 de site in totaal 10 minuten heeft bezocht. Het gemiddelde van die 2 is een engagementduur van 9 minuten.
De gemiddelde engagementduur in het diagram ziet er als volgt uit:
- 2 juli: 3m 00s
- 3 juli: 4m 00s
- 4 juli: 5m 30s
Sessies met engagement per gebruiker
- Op 2 juli heeft gebruiker 1 1 sessie met engagement gehad.
- Op 3 juli heeft gebruiker 2 2 sessies met engagement gehad.
- Op 4 juli heeft gebruiker 1 3 sessies met engagement gehad en heeft gebruiker 2 2 sessies met engagement gehad.
In dit voorbeeld is het aantal sessies met engagement per gebruiker op het tabblad 4, omdat gebruiker 1 in juli in totaal 4 sessies met engagement heeft gehad en gebruiker 2 in juli in totaal 4 sessies met engagement heeft gehad. Het gemiddelde van die 2 engagementduren is 4 sessies met engagement.
Het aantal sessies met engagement per gebruiker in het diagram ziet er als volgt uit:
- 2 juli: 1 sessie met engagement
- 3 juli: 2 sessies met engagement
- 4 juli: 2,5 sessies met engagement
Gemiddelde engagementduur per sessie
- Op 2 juli heeft gebruiker 1 1 sessie met engagement van 3 minuten.
- Op 3 juli heeft gebruiker 2 2 sessies met engagement van 3,5 minuut en 4,5 minuut.
- Op 4 juli heeft gebruiker 1 1 sessie met engagement van 4 minuten en heeft gebruiker 2 1 sessie met engagement van 6 minuten.
In dit voorbeeld zou de gemiddelde engagementduur per sessie op het tabblad 10 minuten en 30 seconden zijn omdat gebruiker 1 in juli in totaal 7 minuten aan engagementduur had en gebruiker 2 in juli in totaal 14 minuten engagementduur had. Het gemiddelde van die 2 is een engagementduur van 10,5 minuten.
De gemiddelde engagementduur per sessie in het diagram ziet er als volgt uit:
- 2 juli: 3 minuten engagementduur
- 3 juli: 4 minuten engagementduur
- 4 juli: 5 minuten engagementduur
Gebruikersloyaliteit
De kaart Gebruikersloyaliteit toont het percentage gebruikers dat in de 1e 42 dagen elke dag terugkeert. Het diagram begint met 100% gebruikersloyaliteit als alle gebruikers voor het eerst de site of app bezoeken. Dit percentage daalt vanaf de eerste dag omdat het aantal gebruikers terugloopt.

Gebruikersactiviteit per cohort
De kaart 'Gebruikersactiviteit per cohort' geeft aan of een groter percentage van de gebruikers die u op een bepaalde datum krijgt, terugkeert dan van de gebruikers die u op een andere datum krijgt. Elke rij staat voor een cohort. De onderste rij staat voor het meest recente cohort, terwijl de bovenste rij het eerste cohort vertegenwoordigt. De donkere arceringen geven aan dat een hoger percentage gebruikers in het cohort is teruggekeerd. De arcering wordt lichter als minder gebruikers terugkeren. Het diagram bevat een link naar het rapport Loyaliteitsoverzicht.

Weergaven per paginatitel en schermklasse
De kaart 'Weergaven per paginatitel en schermklasse' toont het aantal keren dat gebruikers elke pagina of elk scherm hebben bekeken in de opgegeven periode, gesorteerd op de meest bekeken pagina's en schermen.
In de onderstaande tabel zijn de pagina's met de homepage en het winkelwagentje de meest bekeken pagina's. U kunt op Pagina's en schermen bekijken klikken om het rapport Pagina's en schermen te openen.

Aantal gebeurtenissen per gebeurtenisnaam
De kaart 'Aantal gebeurtenissen per gebeurtenisnaam' toont het aantal keren dat gebruikers elke gebeurtenis in de opgegeven periode hebben geactiveerd, gesorteerd op de meest geactiveerde gebeurtenis.
In de onderstaande tabel zijn de gebeurtenissen screen_view en user_engagement bijvoorbeeld de meest geactiveerde gebeurtenissen. U kunt op een gebeurtenis in de tabel klikken (bijv. screen_view) om een rapport over de gebeurtenis te openen. U kunt ook op Gebeurtenissen bekijken klikken om het rapport Gebeurtenissen te openen.

Conversies per gebeurtenisnaam
De kaart 'Conversies per gebeurtenisnaam' toont hoe vaak gebruikers elke conversiegebeurtenis activeren. Hoewel Analytics sommige gebeurtenissen automatisch als conversies verzamelt, kunt u elke gebeurtenis markeren als een conversiegebeurtenis.

Totale opbrengst
Aankoopopbrengst
Totale advertentieopbrengst
Gemiddelde aankoopopbrengst per gebruiker
Advertentievertoningen van uitgever per advertentieblok
De kaart Advertentievertoningen van uitgever per advertentieblok toont het aantal advertentievertoningen per advertentieblok in de opgegeven periode en de procentuele wijziging ten opzichte van de vorige periode. U kunt op Advertenties van uitgever tonen klikken om het rapport Advertenties van uitgever te openen.

Gebruikers per land
De kaart Gebruikers per land toont de landen van waaruit gebruikers uw app openen, gesorteerd op de landen met de meeste gebruikers. Op de kaart staat een wereldkaart. Hoe donkerder blauw het land, hoe meer gebruikers er in dat land zijn.
Plaats de cursor op een land om het aantal gebruikers in dat land te bekijken of klik op Landen tonen om het rapport Demografische gegevens te openen voor meer informatie over gebruikers uit elk land.

Gebruikers per apparaatmodel
De kaart Gebruikers per apparaatmodel toont de apparaatmodellen van waaruit gebruikers toegang hebben tot uw app, gesorteerd op de apparaatmodellen met de meeste gebruikers. Klik op Apparaatmodellen bekijken om het rapport Technische gegevens te openen voor meer informatie over gebruikers die elk apparaatmodellen gebruiken.
