Adding static design elements can add visual appeal and context to your data stories. As a best practice, use these elements sparingly to avoid having your reports look cluttered or distracting from the data.
Click the corresponding icon on the toolbar to add the following components to your reports:

- Text
- Image
- Line
- Rectangle
- Circle
Add text
Use text to add titles, headings, and descriptions to your reports. You can also use text to create hyperlinks to pages within your report, to other Looker Studio reports, or to any web-accessible resource.
- In the toolbar, click the Text icon.
- Draw a box on the canvas.
- Enter your text in the box.
To style the text
- Select the text.
- On the right, use the Text Properties options to change font, size, color, padding, and other aspects of the text.
Make the text scrollable
Use the Overflow settings > Hidden option to create a scrollable text box.
Add images
Use images to add logos and graphics to your report.
- In the toolbar, click the Image icon.
- Select an image file from your hard drive, or enter the URL for an image hosted on the web.
You can add most common image file formats, such as .png, .jpg, .svg, etc.You can also drag and drop images directly from your hard drive or a web page to the report canvas.Looker Studio can't display copyrighted images from Google Images. If you add a copyrighted image, you'll see an overlay on top of your report. To remove the overlay, refresh the report.
- Draw a box on the canvas where you want the image to appear. The size of the box determines the size of the image.
- On the right, in the properties panel, select the SETUP tab.
- Use the Image link URL field to make the image a clickable link. The link must begin with the https protocol.
- In the right-hand Properties Panel, select the Style tab.
- Use the Style tab to change the background and border options.
Add rectangles and circles
Use shapes to create visual separation of data elements, banners, and other graphical effects.
- In the toolbar, click the Rectangle or Circle icon.
- Draw a box on the canvas where you want the shape to appear.
- To draw a perfect circle, hold the shift key while drawing or resizing the circle.
- On the right, use the Rectangle or Circle Properties panel options to change the appearance of the shape.
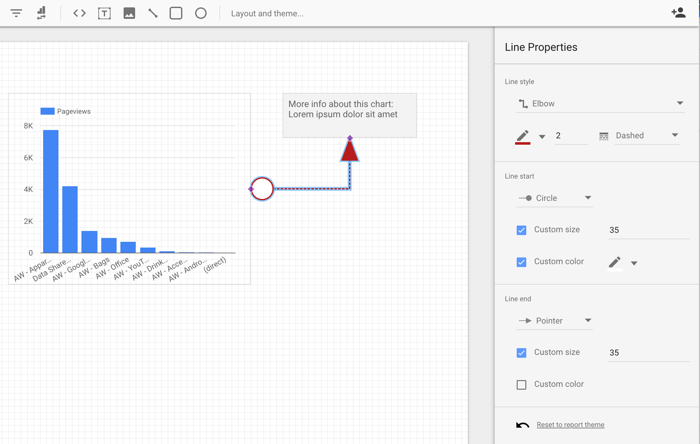
Add lines and arrows
Use lines and arrows to indicate areas of note, or to connect elements in report.
- In the toolbar, click the Line icon.
- Draw a line on the canvas.
- To connect two components with a line, drag each end of the line over the component until the colored anchor points appear. Then connect the line ends to the anchor points. If you move the components, the line will adjust to keep them connected.
- On the right, use the Line Properties panel options to change the appearance of the line.