| This feature is only available in Analytics 360, part of Google Marketing Platform. Learn more about Google Marketing Platform. |
The free-form exploration technique presents your data in a flexible table layout. You can arrange the rows and columns as you like, create data groupings, and apply segments and filters to refine your view. Add the metrics you're most interested in. If you spot a significant data point, create a segment from it and use it in other explorations.
Quick Tips: Advanced Analysis explorations
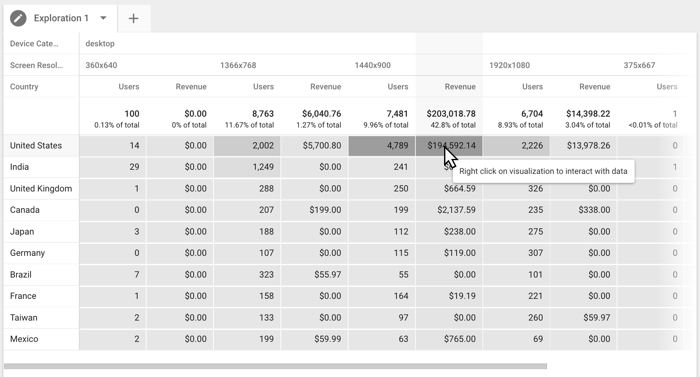
The example below explores the relationship between Device Category and Screen Resolution by Country, measured by number of Users and Revenue. The table reveals that while the screen resolution for the majority of desktop users is 1366x768, the bulk of the revenue is generated by users on 1440x900 screens. You could create a segment from this data point and use that to dig deeper into this audience's behavior.
You can also display the data using a number of different visualizations: this example shows a line chart comparison of the Mobile vs. Organic Traffic segments applied to the previous data table:

Configure the free-form exploration
Set up the free-form exploration with these options:
| Common Options | Description |
|---|---|
| Visualization |
Switch between chart types. |
| Segment comparison | Apply up to 4 segments to the exploration. |
| Filter | Restrict the data shown in the exploration according to the conditions you provide. Filter clauses are applied using AND logic. |
| Table options | |
| Pivot | Display segments in the table as rows or columns. |
| Rows | Display up to 5 dimensions as rows in the table. |
| Start row | Select the starting row in the table. |
| Show rows | Set the number of rows to show in the table. |
| Columns | Display up to 2 dimensions as columns in the table. Using multiple dimensions creates column groups. |
| Start column group | Set the starting column group in the table. |
| Show column groups | Set the number of column groups to display in the table. |
| Values | Display up to 10 metrics in the table. |
| Cell type | Display metric values as plain text, bar charts, or heat maps. |
| Pie chart options | |
| Breakdown | The dimension used to provide the breakdown data series for the visualization. |
| Row limit | Set the number of data series displayed in the visualization. |
| Values | Display a single metric in the charts. |
| Line chart options | |
| Granularity | Set the date interval for the chart. The week interval starts on Sunday. The month interval starts on the 1st day of the month. |
| Breakdown | The dimension used to provide the breakdown data series for the visualization. |
| Lines per dimension | Set the number of data series displayed in the visualization. |
