Enhanced Ecommerce provides you with a number of insightful and actionable reports. Following are some of the reports at your disposal when you enable Enhanced Ecommerce for a view.
In this article:- Prerequisites
- See Enhanced Ecommerce reports
- Available Data
- Ecommerce Overview
- Shopping Behavior Analysis
- Checkout Behavior Analysis
- Shopping Behavior and Checkout Behavior funnels
- Product Performance
- Sales Performance
- Product List Performance
- Internal Promotion
- Order Coupon
- Product Coupon
- Affiliate Code
- Related resources
Prerequisites
See Enhanced Ecommerce reports
To access Enhanced Ecommerce reports:- Sign in to your Analytics account.
- Navigate to your view.
- Open Reports.
- Select Conversions > Ecommerce.
Available Data
The Overview report lets you see the overall state of your business, and provides three categories of related metrics:
Revenue and Conversion Rate
- Revenue (total revenue from your ecommerce transactions, may include tax and shipping)
- Ecommerce Conversion Rate (ratio of transactions to sessions, expressed as a percentage)
Transactions
- Transactions (total number of completed transactions on your site)
- Average Order Value (average value of each order)
- Average Quantity (average quantity of products sold per transaction)
Marketing
The number of impressions for internal promotions.
The total number of transactions, the total revenue, and the average order value for:
- Campaigns
- Order Coupon Code
- Affiliation
In addition to the aggregated metrics, you can also see discrete Revenue metrics by individual product, product category, and product brand.
Use the graph at the top of the report to compare two of the Ecommerce metrics across the date range you’re using.
Ecommerce Overview
The Overview reports gives you a summary of:
- Revenue
- Ecommerce Conversion Rate
- Transactions
- Average Order Value
- Marketing (Campaigns, Internal Promotions, Order Coupon Code, Affiliation)
- Top Sellers (by Product, Category, and Brand)
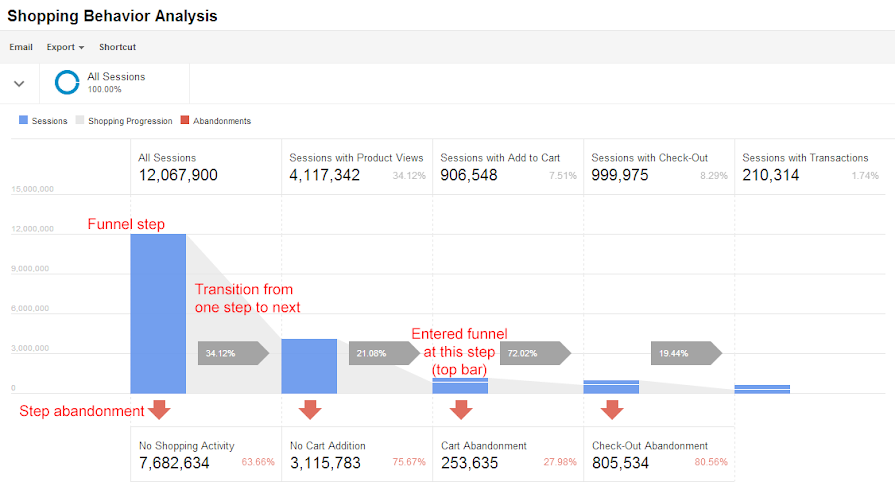
Shopping Behavior Analysis
The Shopping Behavior Analysis report lets you see the number of sessions that included each stage of your purchase funnel, how many sessions continued from one step to the next, and how many abandoned the funnel at each stage. Where the funnel indicates abandonment (a red arrow at the bottom of a step), those users did not complete any additional steps of the funnel during the same session. Users can reenter the funnel at any stage (indicated by the separate blue bar at the top of a step); for example, if a user added something to the cart during one session, and then came back to complete the purchase in a subsequent session, the funnel visualization would count the user as reentering at the Checkout step.
You can evaluate your users’ shopping experience from product impression to transaction.
Analytics determines the funnel steps based on your tagging. Learn more about tagging your shopping funnel.
Use the funnel visualization to identify strengths and weaknesses in your purchase funnel. See Evaluate purchase-funnel performance for analysis examples.
In addition to being able to visualize the number of sessions that moved through the funnel, you can use the visualization to create segments of your sessions; for example, the number of sessions that included product views, or the number of sessions that abandoned the funnel at checkout. Simply click a funnel step or abandonment arrow to create a segment. Learn more about creating segments from your funnel.
In addition to the funnel, the table lets you evaluate a number of dimensions and metrics in the context of sessions in general or sessions during which users abandoned the purchase funnel.
How Enhanced Ecommerce shopping-stage dimensions map to funnel-step metrics| Shopping-stage dimension | Funnel-step metrics |
|---|---|
| ALL_VISITS | All Sessions |
| NO_SHOPPING_ACTIVITY | No Shopping Activity Exited first step without a detail, add, checkout, or purchase action sent with hit |
| PRODUCT_VIEW | Sessions with Product Views At least 1 detail action sent with hit |
| NO_CART_ADDITION | No Cart Addition At least 1 detail action, but no add, checkout, or purchase action sent with hit |
| ADD_TO_CART | Sessions with Add to Cart |
| ADD_TO_CART_WITHOUT_VIEW | Sessions with Add to Cart (top slice) Entered funnel at this step, no detail action sent with hit |
| ADD_TO_CART_WITH_VIEW | Sessions with Add to Cart (bottom slice) At least 1 detail action sent with hit, includes previous and current step |
| CART_ABANDONMENT | Cart Abandonment At least 1 add action, but no checkout or purchase action sent with hit |
| CHECKOUT | Sessions with Checkout |
| CHECKOUT_WITHOUT_CART_ADDITION | Sessions with Checkout (top slice) Entered funnel at this step, no add action sent with hit |
| CHECKOUT_WITH_CART_ADDITION | Sessions with Checkout (bottom slice) At least 1 add action sent with hit, includes previous and current step |
| CHECKOUT_ABANDONMENT | Check-out Abandonment At least 1 checkout action, but no purchase action sent with hit |
| TRANSACTION | Sessions with Transactions At least one purchase action sent with hit |
| TRANSACTION_WITHOUT_CHECKOUT | Sessions with Transactions (top slice) Entered funnel at this step, no checkout action sent with hit |
Checkout Behavior Analysis
The Checkout Behavior Analysis report lets you see how successfully your users moved through your checkout process. The checkout-funnel visualization illustrates how many users moved on from one step to the next, how many abandoned the process at each step, and how many entered the process at each step..
Analytics determines the funnel steps based on your tagging. Learn more about tagging your checkout funnel.
Use the funnel visualization to identify strengths and weaknesses in your checkout funnel. See Checkout-funnel performance for analysis examples.
In addition to being able to visualize the number of sessions that moved through the funnel, you can use the visualization to create segments of those sessions; for example, sessions that included Step 1, sessions that included user transitions from Step 1 to Step 2, the sessions that abandoned the funnel at the final step, or the sessions that entered the funnel at the final step. Simply click a funnel step, transition, abandonment arrow, or the entrance at a given step (the topmost bar in a step) to create a segment. Learn more about creating segments from your funnel.
In addition to the funnel, the table lets you evaluate a number of dimensions and metrics in the context of sessions in general or sessions during which users abandoned the checkout funnel.
How Enhanced Ecommerce checkout-behavior dimensions map to funnel-step metrics| Checkout-behavior dimension | Funnel-step metrics |
|---|---|
| CHECKOUT_1 | Checkout Step 1, e.g., Billing Sent with hit: at least 1 checkout action with Step = 1 or at least 1 checkout action with no step specified |
| CHECKOUT_1_ABANDONMENT | Checkout Step 1 abandonment, e.g., Billing Dropoff Sent with hit: at least 1 checkout action with no step specified or with Step 1 specified, but no subsequent checkout or purchase steps |
| CHECKOUT_2_WITHOUT_CHECKOUT | Checkout Step 2 (top slice), e.g., Shipping Entered funnel at this step, no checkout action with Step = 1 sent with hit |
| CHECKOUT_2 | Checkout Step 2 (bottom slice), e.g., Shipping At least 1 checkout action sent with hit, includes previous and current step |
| CHECKOUT_2_ABANDONMENT | Checkout Step 2 abandonment, e.g., Shipping Dropoff Sent with hit: at least 1 checkout action with Step = 2, but no subsequent checkout or purchase steps |
| CHECKOUT_3_WITHOUT_CHECKOUT | Checkout Step 3 (top slice), e.g., Payment Entered funnel at this step, no checkout action with Step = 2 sent with hit |
| CHECKOUT_3 | Checkout Step 3 (bottom slice), e.g., Payment At least 1 checkout action sent with hit, includes previous and current step |
| CHECKOUT_3_ABANDONMENT | Checkout Step 3 abandonment, e.g., Payment Dropoff Sent with hit: at least 1 checkout action with Step = 3, but no subsequent checkout or purchase steps |
| CHECKOUT_4_WITHOUT_CHECKOUT | Checkout Step 4 (top slice), e.g., Review Entered funnel at this step, no checkout action with Step = 3 sent with hit |
| CHECKOUT_4 | Checkout Step 4 (bottom slice), e.g., Review At least 1 checkout action sent with hit, includes previous and current step |
| CHECKOUT_4_ABANDONMENT | Checkout Step 4 abandonment, e.g., Review Dropoff Sent with hit: at least 1 checkout action with Step = 4, but no subsequent checkout or purchase steps |
| TRANSACTION | Sessions with Transactions At least one purchase action sent with hit |
| TRANSACTION_WITHOUT_CHECKOUT | Sessions with Transactions (top slice) Entered funnel at this step, no checkout action with Step = 4 sent with hit |
Shopping Behavior and Check Behavior funnels
This section explains how the Shopping Behavior and Checkout Behavior reports handle users looping back through pages in a funnel, users skipping pages in a funnel, and users not following the sequence of the funnel.
The examples use a three-page funnel: Page A > Page B > Page C
Looping back
Page A > Page B > Page C > Page B > Page C
The user looped back from Page C to Page B, continued through the sequence of the funnel, and consequently opened Pages B and C multiple times.
The reports show the user moving through the funnel from start to finish since the user didn't skip any pages during that single session.
A user is counted only once for each page because the funnel is illustrating the number of sessions during which each page was opened.
Skipping pages
Page A > Page C
The user never opened Page B.
The report shows that the user skipped Page B.
Not following the funnel sequence
Page B > Page A > Page C
The reports show the user moving through the funnel from start to finish because the user opened all 3 pages during a single session. It doesn't matter in which order the user opened the pages.
Product Performance
The Product Performance report lets you see how your products performed from two different points of view:
- Summary: Product performance in terms of revenue, price, and quantity. Includes two of the Shopping Behavior metrics.
- Shopping Behavior: Product performance in terms of user engagement with your products (e.g., viewing products and details, adding and removing products from carts, completing checkouts).
The Summary view includes the following metrics:
- Sales Performance
- Product Revenue (revenue from individual product sales)
- Unique Purchases
- Quantity (number of units sold)
- Average Price (average revenue per product)
- Average Quantity
- Product Refund Amount (amount returned to users as refunds)
- Shopping Behavior
- Cart-to-Detail Rate (number of products added per number of product-detail views)
- Buy-to-Detail Rate (number of products purchased per number of product-detail views)
The Shopping Behavior view includes the following metrics:
- Sales Performance
- Product List Views
- Product Detail Views
- Product Adds (to carts)
- Product Removes (from carts)
- Product Checkouts
- Unique Purchases
- Shopping Behavior
- Cart-to-Detail Rate (number of products added per number of product-detail views)
- Buy-to-Detail Rate (number of products purchased per number of product-detail views)
The available primary dimensions are Product, ProductSKU, Product Category, Product Brand, and Shopping Stage.
Use the graph at the top of the report to compare two of the Ecommerce metrics across the date range you’re using.
Sales Performance
The Sales Performance report lets you evaluate sales by either of two primary dimensions:
- Transaction (date, time, transaction ID)
- Date (cumulative transaction data by date)
The Sales Performance report includes the following metrics:
- Revenue (total revenue from ecommerce transactions; depending on your implementation, this can include tax and shipping)
- Tax (total tax charges for ecommerce transactions)
- Shipping (total shipping charges for ecommerce transactions)
- Refund Amount (Currency amount refunded for a transaction)
- Quantity (number of units sold in ecommerce transactions)
Product List Performance
Product Lists represent a logical grouping of products on your site, based on your ec.js tagging. You can use them to represent:
- Catalog pages
- Cross-sell blocks
- Up-sell blocks
- Related-products blocks
- Search results pages
The Product List Performance report lets you see how the Product Lists on your site performed based on the following metrics:
- Product List Views (number of times users viewed products when they appeared in the product list)
- Product List Clicks (number of times users clicked products when they appeared in the product list)
- Product List CTR (the rate at which users clicked the product list to view products (number of clicks divided by the number of times the list appeared)
The available primary dimensions are Product List Name, Product List Position, Product, and ProductSKU.
Use the graph to compare two of the Ecommerce metrics across the date range you’re using.
Internal Promotion
Internal promotions include things like banners that you display on one section of your site to advertise another section of your site.
The Internal Promotion report lets you see how your internal promotions performed in terms of the following metrics:
- Internal Promotion Views (number of times users viewed internal promotions)
- Internal Promotion Clicks (number of times users clicked internal promotions)
- Internal Promotion CTR (the rate at which users click internal promotions (views/clicks))
Internal Promotion Name is the primary dimension.
Use the graph to compare two of the Ecommerce metrics across the date range you’re using.
How transactions are attributed
The Internal Promotion report attributes transactions to either an internal-promotion click or internal-promotion view.
Each hit in an ecommerce session can have:
- 0 or 1 internal-promotion clicks
- 0 or more internal-promotion views
Internal-promotion click attribution
If a hit includes a single internal-promotion click, then that internal-promotion is credited for the transaction.
If a session includes multiple internal-promotion clicks, then the last-clicked internal-promotion is credited for the transaction.
If a hit includes zero internal-promotions clicks but one of that user’s previous hits does include an internal-promotion click, then the internal promotion from the previous click is credited for the transaction.
Internal-promotion view attribution
If none of the conditions above is true but a hit includes one or more internal-promotion views, then the transaction is credited to all promotional views within the session.
Order Coupon
The Order Coupon report lets you see how your order-level coupons performed in terms of the following metrics:
- Revenue (total revenue from ecommerce transactions; depending on your implementation, this can include tax and shipping)
- Transactions (total number of completed purchases on your site)
- Average Value (average value of ecommerce transactions)
Order Coupon Code is the primary dimension.
Use the graph to compare two of the Ecommerce metrics across the date range you’re using.
Product Coupon
The Product Coupon report lets you see how your product-level coupons performed in terms of the following metrics:
- Revenue (total revenue from ecommerce transactions; depending on your implementation, this can include tax and shipping)
- Unique Purchases (total number of times a specified product (or set of products) was a part of a transaction)
- Product Revenue per Purchase (average product revenue per purchase)
Product Coupon Code is the primary dimension.
Use the graph to compare two of the Ecommerce metrics across the date range you’re using.
Affiliate Code
The Affiliate Code report lets you see how your affiliate sites contributed to your ecommerce performance in terms of the following metrics:
- Revenue (total revenue from ecommerce transactions; depending on your implementation, this can include tax and shipping)
- Transactions (total number of completed purchases on your site)
- Average Order Value (average value of ecommerce transactions)
Affiliation is the primary dimension.
Use the graph to compare two of the Ecommerce metrics across the date range you’re using.
Related resources
Learn more about using these reports to analyze shopping and purchasing behavior, economic performance, and your merchandising efforts
