The Tech overview report is a pre-made overview report that provides an overview of the technologies people are using to access your website or app, such as their browser, device model, and screen resolution. The data in this report is updated automatically from the web pages and app screens with the Google Analytics measurement code installed.
The Tech overview report appears on the left only in the Life cycle collection. You won't see the report in the Business objectives collection by default; however, an editor or administrator can add the report to your left navigation.
View the report
- Sign in to Google Analytics.
- In Reports
 , under the User collection, click Tech > Overview.
Note: If you don't see the report, the report may have been removed, or the report isn't included in your default set of reports. If you're an editor or administrator, you can add the report to the left navigation. Learn
How to add the report.
Pre-made summary cards
The Tech overview report includes the following summary cards by default. Administrators and editors can change the cards so you may see different ones from these.
Users by Platform
Users by Platform shows the top most used platforms and the number of active users who used each platform. A platform is a method by which someone accesses your website or app, such as 'Android,' 'iOS,' and 'Web.'
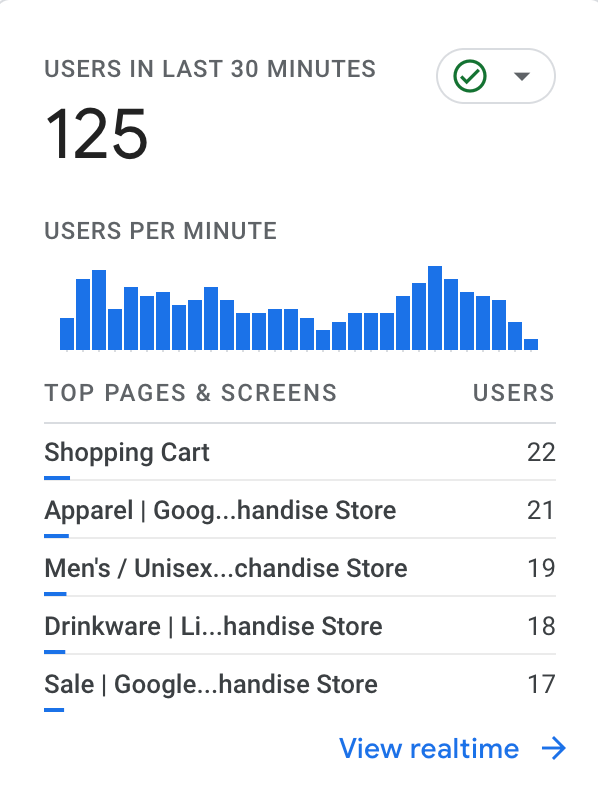
Users in last 30 minutes
Users in last 30 minutes shows activity as it happens using data from the Realtime report. The first half of the card shows the total number of users in the last 30 minutes and the number of users in the last 30 minutes per minute.
The second half of the card includes realtime activity for a relevant dimension. For example, the Engagement overview report may show the top pages and screens users are visiting right now, while the User attributes overview report may show the top countries users are visiting from right now.

Users by Operating system
Users by Operating system shows the break down of active users by operating system. Typical operating systems include 'Android', 'Chrome OS', 'Macintosh', and 'Windows'.
Users by Platform / device category
Users by Platform / device category shows the top most used platform-device combinations and the number of active users who used each platform.
A platform is a method by which someone accesses your website or app, such as 'Android,' 'iOS,' and 'Web.' A device category is the type of device from which user activity originated. Device categories include 'desktop', 'mobile', and 'tablet'.
Users by Browser
Users by Browser shows the break down of active users by the browser from which user activity originated. Typical browsers include 'Chrome', 'Edge', 'Firefox', 'Internet Explorer', 'Opera', and 'Safari'.
Users by Device category
Users by Device category shows the break down of active users by the device category, which is the type of device from which user activity originated. Device categories include 'desktop', 'mobile', and 'tablet'.
Users by Screen resolution
Users by Screen resolution shows the break down of active users by the screen resolution, which is the width and height (in pixels) of the screen from which user activity originates. Examples include '1920x1080', '1440x900', and '1366x768'.
Users by App version
Users by App version shows the break down of active users by their mobile app version. An app version is the mobile app's versionName (Android) or short bundle version (iOS).
Latest app release overview
Latest app release overview shows the status of the latest release of each version (e.g., Android, iOS) of your app. You can select a version to open the following dashboard, where you can see insights about the app. The dashboard provides the same information as what the Latest Release report provides in
the Firebase console.
Learn more about the report
Users by Device model
Users by Device model shows the break down of active users by their device model, which is the device model name (e.g., iPhone 5s or SM-J500M).
, under the User collection, click Tech > Overview.