The Acquisition overview report is a pre-made overview report that summarizes your acquisition data. The report can help you see if your marketing efforts are attracting new users to your website or app, if your re-engagement campaigns are bringing people back, and if you should continue with or adjust your marketing strategies.
The report appears on the left in the Life cycle collection. You won't see the report in the Business objectives collection by default, but an editor or administrator can add the report to your left navigation.
How to find where your users are coming from using Acquisition Reports in Google Analytics 4
View the report
- From the left menu, select Reports
.
- On the left, expand Acquisition in the Life cycle collection.
- Click Acquisition overview.
Pre-made summary cards
The Acquisition overview report includes the following summary cards by default. Administrators and editors can change the cards so you may see different ones from these.
Users and New users
Users shows the total number of users who visited your website or app. The value in the tab shows the total number of users in the specified time period, while the individual data points show the number of users for that day.
New users shows the number of users who visited your website or app for the first time. The value in the tab shows the total number of new users in the specified time period, while the individual data points show the number of new users for that day.
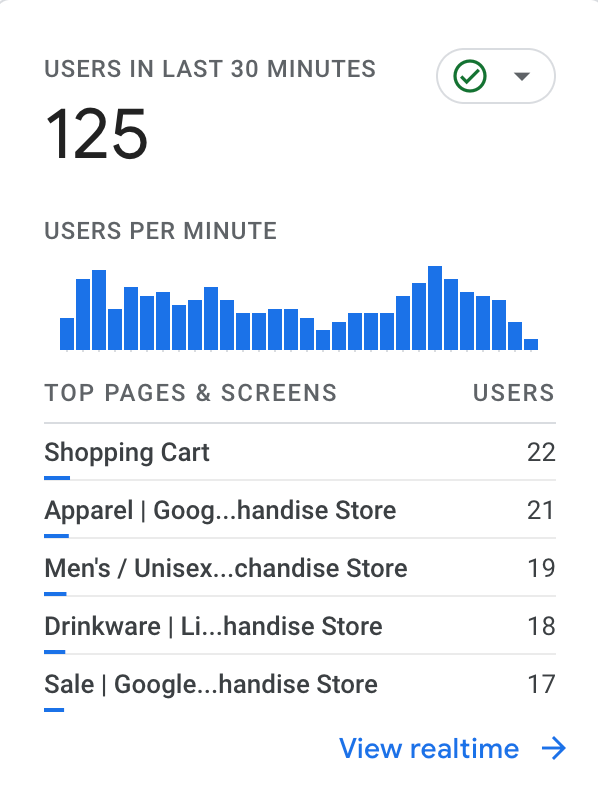
Users in last 30 minutes
Users in last 30 minutes shows activity as it happens using data from the Realtime report. The first half of the card shows the total number of users in the last 30 minutes and the number of users in the last 30 minutes per minute.
The second half of the card includes realtime activity for a relevant dimension. For example, the Engagement overview report may show the top pages and screens users are visiting right now, while the User attributes overview report may show the top countries users are visiting from right now.
New users by First user default channel group
Sessions by Session default channel group
Sessions by Session Google Ads campaign
Lifetime value

Lifetime value shows the average revenue generated by new users over their first 120 days. The chart can help you determine how valuable users are based on the additional revenue you generate. For example, a user purchases a shirt and then purchases pants the following week. Lifetime value (LTV) includes both purchases, indicating the overall success of the acquisition.