The Engagement overview report is a pre-made overview report that summarizes your engagement data. The report can help you compare key engagement metrics over time, understand which pages and screens people are visiting, and identify the features they're interacting with.
The report appears on the left in the Life cycle collection. You won't see the report in the Business objectives collection by default, but an editor or administrator can add the report to your left navigation.
How do users interact with your website or app? Use Engagement reports in Google Analytics
View the report
- From the left menu, select Reports
.
- On the left, expand Engagement in the Life cycle collection.
- Click Engagement overview.
Pre-made summary cards
The Engagement overview report includes the following summary cards by default. Administrators and editors can change the cards so you may see different ones from these.
Average engagement time
- On July 2, user #1 visited for 3 minutes.
- On July 3, user #2 visited for 4 minutes.
- On July 4, user #1 visited for 5 minutes and user #2 visited for 6 minutes.
In this example, the average engagement time in the tab would be 9m 00s because user #1 visited for a total of 8 minutes and user #2 visited for a total of 10 minutes in July. The average of those two engagement times would be 9 minutes.
The average engagement time in the chart would look like the following:
- July 2: 3m 00s
- July 3: 4m 00s
- July 4: 5m 30s
Engaged sessions per user
- On July 2, user #1 has 1 engaged session.
- On July 3, user #2 has 2 engaged sessions.
- On July 4, user #1 has 3 engaged sessions and user #2 has 2 engaged sessions.
In this example, the engaged sessions per user in the tab would be 4 because user #1 visited for a total of 4 engaged sessions and user #2 visited for a total of 4 engaged sessions in July. The average of those two engagement times would be 4 engaged sessions.
The engaged sessions per user in the chart would look like the following:
- July 2: 1 engaged session
- July 3: 2 engaged sessions
- July 4: 2.5 engaged sessions
Average engagement time per session
- On July 2, user #1 has one engaged session of 3 minutes.
- On July 3, user #2 has two engaged sessions of 3.5 minutes and 4.5 minutes.
- On July 4, user #1 has one engaged session of 4 minutes and user #2 has one engaged session of 6 minutes.
In this example, the average engagement time per session in the tab would be 10m 30s because user #1 had a total of 7 minutes of engagement time and user #2 had a total of 14 minutes of engagement time in July. The average of those two engagement times would be 10.5 minutes of engagement time.
The average engagement time per session in the chart would look like the following:
- July 2: 3 minutes of engagement time
- July 3: 4 minutes of engagement time
- July 4: 5 minutes of engagement time
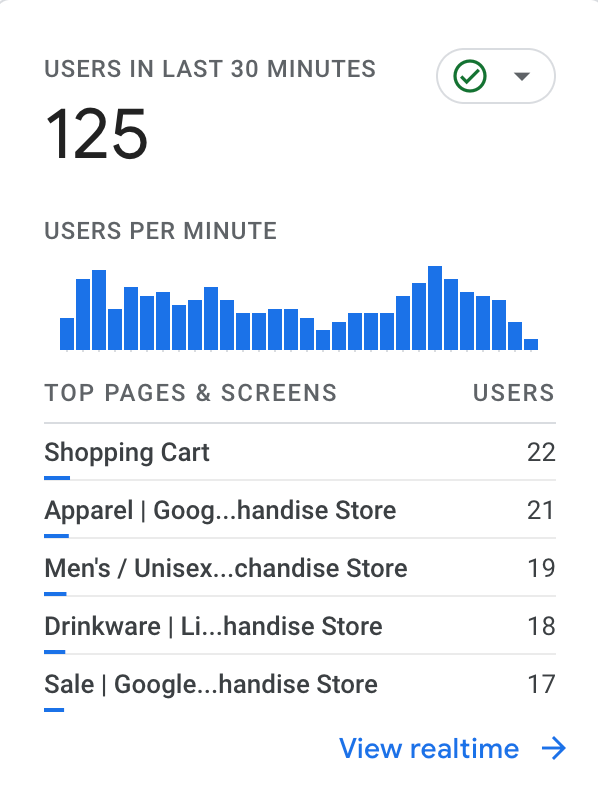
Users in last 30 minutes
Users in last 30 minutes shows activity as it happens using data from the Realtime report. The first half of the card shows the total number of users in the last 30 minutes and the number of users in the last 30 minutes per minute.
The second half of the card includes realtime activity for a relevant dimension. For example, the Engagement overview report may show the top pages and screens users are visiting right now, while the User attributes overview report may show the top countries users are visiting from right now.
Views and Event count

Event count by Event name
You could click any event in the table (e.g., "screen_view") to open a report about the event, or you could click "View events" to open the Events report.

Views by Page title and screen class
For example, in the following table, the Home and Shopping Cart pages were the most frequently viewed pages. You could click "View pages and screens" to open the Pages and screens report.

User activity over time
User activity over time shows the number of people who used your website or app in the past 30 days, 7 days, and 1 day. You can use the card to see changes in activity over a shorter timeframe compared to changes over a broader timeframe. The card includes only users who engaged with your app in the device foreground.
For example, in the following chart, you would have 72K users in the past 30 days and 3.5K users in the past 1 day. If the number of users in the past 1 day were to begin to trend downwards, you could expect to see fewer users over the past 7 and 30 days in the near future.

User stickiness
User stickiness compares engagement by active users over a narrower time frame with their engagement over a broader time frame. The ratios can help you understand how well you retain users over time — higher ratios suggest good engagement and user retention.

Google Analytics calculates the following ratios automatically:
- Daily Active Users (DAU) / Monthly Active Users (MAU)
- Daily Active Users (DAU) / Weekly Active Users (WAU)
- Weekly Active Users (WAU) / Monthly Active Users (MAU)
The ratios consist of the following values:
- Daily Active Users (DAU): the number of active users in the last 24 hours
- Weekly Active Users (WAU): the number of active users in the last 7 days
- Monthly Active Users (MAU): the number of active users in the last 30 days
For example, the ratio "DAU / MAU" shows the percentage of users who engaged with your website or app in the last 24 hours compared to those who engaged in the last 30 days. If users engaged with your website or app daily, the ratio will be 100%. If some users engaged with your site or app in the past month, but didn't visit in the past day, the ratio will be less than 100%.