Übersicht
Jeder Bericht in Google Analytics besteht aus Dimensionen und Messwerten.
Dimensionen sind Attribute Ihrer Daten. Die Dimension Stadt gibt beispielsweise die Stadt an, in der die Sitzung gestartet wurde, etwa "Berlin" oder "München". Die Dimension Seite gibt die URL der aufgerufenen Seite an.
Messwerte sind Werte, die gemessen werden können. Der Messwert Sitzungen entspricht der Gesamtanzahl der Sitzungen. Der Messwert Seiten/Sitzung gibt die durchschnittliche Anzahl der Seiten an, die pro Sitzung aufgerufen werden.
In den Tabellen der Analytics-Berichte werden Dimensionen in der Regel in Zeilen und Messwerte in Spalten angeordnet. Diese Tabelle zeigt beispielsweise eine Dimension (Stadt) und zwei Messwerte (Sitzungen und Seiten/Sitzung).
| DIMENSION | MESSWERT | MESSWERT |
|---|---|---|
| Stadt | Sitzungen | Seiten/Sitzung |
| München | 5.000 | 3,74 |
| Berlin | 4.000 | 4,55 |
In den meisten Analytics-Berichten können Sie die Dimension ändern und/oder eine sekundäre Dimension hinzufügen. Wenn Sie bei der Tabelle oben beispielsweise „Browser“ als sekundäre Dimension festlegen, würden die Ergebnisse so aussehen:
| DIMENSION | DIMENSION | MESSWERT | MESSWERT |
|---|---|---|---|
| Stadt | Browser | Sitzungen | Seiten/Sitzung |
| München | Google Chrome | 3.000 | 3,5 |
| München | Mozilla Firefox | 2.000 | 4,1 |
| Berlin | Google Chrome | 2.000 | 5,5 |
| Berlin | Safari | 1.000 | 2,5 |
| Berlin | Mozilla Firefox | 1.000 | 4,7 |
Gültige Kombinationen von Dimensionen und Messwerten
Nicht jeder Messwert kann mit jeder Dimension kombiniert werden. Alle Dimensionen und Messwerte haben einen Umfang: Nutzer-, Sitzungs- oder Trefferebene. In den meisten Fällen ist nur die Kombination von Dimensionen und Messwerten mit demselben Umfang sinnvoll. Der sitzungsbasierte Messwert Sitzungen kann beispielsweise nur mit Dimensionen auf Sitzungsebene kombiniert werden wie Quelle oder Stadt. Es macht keinen Sinn, Sitzungen mit einer trefferbasierten Dimension wie Seite zu kombinieren.
Mit dem Referenztool für Dimensionen und Messwerte können Sie eine Liste der gültigen Dimension-Messwert-Paare aufrufen.
Berechnung von Messwerten
In Analytics werden Nutzermesswerte auf zwei Arten berechnet:
- Als Gesamtwert
, wobei der Messwert als statistische Zusammenfassung für Ihre gesamte Website angezeigt wird, z. B. die Absprungrate oder die Seitenaufrufe insgesamt. - Zusammen mit einer oder mehreren Berichtsdimensionen
, wobei der Messwert durch die ausgewählten Dimensionen qualifiziert wird.
Im folgenden Diagramm werden die beiden Berechnungsmethoden anhand eines einfachen Beispiels dargestellt. Links werden die Nutzerdaten als Gesamtwert berechnet, rechts werden dieselben Daten mithilfe der Dimension Neuer Nutzer berechnet.
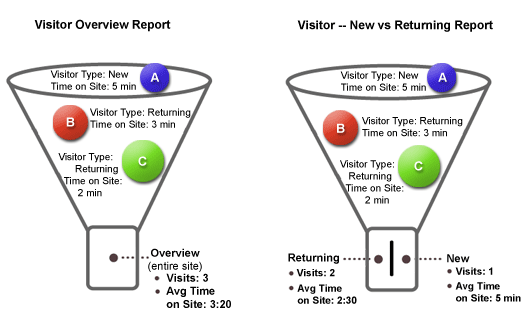
Im Beispiel mit dem Bericht „Übersicht“ wird die Zeit auf der Website anhand der Zeitdifferenz zwischen dem Sitzungsbeginn und ‑ende der einzelnen Nutzer berechnet, wobei die Summe der einzelnen Sitzungslängen dem Durchschnittswert aus drei Sitzungen entspricht. Diese Zahl basiert auf einer relativ einfachen Berechnung, bei der auf Anfrageebene der Zeitstempel erfasst wird.
Im Beispiel mit dem Bericht „Neu und wiederkehrend“ werden keine Durchschnittswerte für alle Sitzungen berechnet. Stattdessen wird die Dimension „Nutzertyp“ verwendet. Wenn Sie den Messwert „Zeit auf der Website“ mit einer Dimension kombinieren, können Sie ihn anhand von wiederkehrenden im Vergleich zu neuen Nutzern analysieren. Dabei hängen die Berechnungen von der ausgewählten Dimension ab. Wenn Sie eine Dimension verwenden, sehen Sie Daten zum Nutzerverhalten, die im Bericht „Übersicht“ nicht enthalten sind: Sie machen deutlich, dass neue Nutzer mehr Zeit auf Ihrer Website verbringen als wiederkehrende.
Wenn Sie mehrere Dimensionen mit einem Messwert kombinieren, wirkt sich das ebenfalls auf die Berechnung des Messwerts aus. Sie können sowohl in vorformatierten als auch in benutzerdefinierten Berichten mehrere Dimensionen gemeinsam verwenden. Angenommen, Sie verwenden die Dimensionen Nutzertyp und Sprache, um die Zeit auf der Website zu analysieren. Hier ist die Berechnung für neue und wiederkehrende Nutzer gleich, wenn Sie neue Nutzer jedoch mithilfe der Dimension „Sprache“ aufschlüsseln, ändert sich die Berechnung durch die zusätzliche Dimension. Die Aufschlüsselung nach Nutzern könnte dann so aussehen, wobei nach der längsten Zeit auf der Website sortiert wird:
| Nutzertyp | Sprache | Durchschn. Besuchszeit auf der Website |
|---|---|---|
| Alle Typen | Alle Sprachen | 3:25 |
| Wiederkehrend | Alle Sprachen | 5:03 |
| Finnisch | 29:49 | |
| Vietnamesisch | 20:44 | |
| Indonesisch | 16:55 | |
| Neu | Alle Sprachen | 2:09 |
| Malaiisch | 17:38 | |
| Englisch (Großbritannien) | 16:56 | |
| Chinesisch (traditionell) | 16:20 |
Diese Zahlen basieren auf einem tatsächlichen Google Analytics-Bericht. Hier können Sie ablesen, ob neue oder wiederkehrende Nutzer länger auf Ihrer Website verweilen. Mit der zusätzlichen Dimension erkennen Sie, auf welchen Sprachen in den einzelnen Kategorien Nutzer am längsten auf der Website geblieben sind.
Attributionsmodelle
Da in Google Analytics-Berichten versucht wird, Fragen zu unterschiedlichem Nutzerverhalten zu beantworten, werden verschiedene Berechnungstypen bzw. Zuordnungsmodelle verwendet, um die Berichtsdaten zu erstellen. Sie können jeden Analytics-Bericht als Antwort auf eine bestimmte Frage zum Thema Nutzeranalyse betrachten. Oft lassen sich diese Fragen bestimmten Kategorien zuordnen:
- Content: Wie oft wurde eine bestimmte Seite aufgerufen?
- Zielvorhaben: Welche Seiten-URLs hatten den höchsten Anteil an der gewünschten Conversion-Rate?
- E-Commerce: Welchen Wert hat eine bestimmte Seite zu einer Transaktion beigetragen?
- Interne Suche: Welche internen Suchbegriffe haben zu einer Transaktion beigetragen?
Für jede dieser übergeordneten Kategorien und die entsprechenden Berichte wird in Google Analytics ein eigenes Attributionsmodell verwendet. Da jedes Zuordnungsmodell zur Berechnung einer bekannten Reihe von Messwerten dient, wird Ihnen womöglich auffallen, dass einige Messwerte wie Seitenaufrufe nur in bestimmten Berichten erscheinen. Grund hierfür ist das Attributionsmodell, das für den Bericht verwendet wird.
In Analytics-Berichten werden drei Attributionsmodelle verwendet:
Attribution pro Anfrage
Dieses Attributionsmodell liefert zusammengefasste Werte für einen einzelnen Messwert oder ein Dimension-Messwert-Paar. Es ist die gängigste und einfachste Attributionsmethode in Analytics, da Werte anhand der GIF-Anfragen einzelner Nutzer ermittelt werden. So ist es möglich, für eine gegebene Anfrage eine bestimmte Dimension und/oder einen bestimmten Messwert abzurufen.
Die meisten Dimensionswerte sind auf Anfrageebene verfügbar und sind entweder für die Anfrage HTTP/GET selbst oder die GIF-Anfrage für jede Seiten- oder Ereignisanfrage an Ihre Website konstant. Folgende gängige Dimensionen sind auf Anfrageebene verfügbar:
- Seiten-URI: Dieser Wert ist für jede Anfrage an Ihre Website verfügbar und gibt den Pfad der Seite an, auf die zugegriffen wird.
- Kampagne: Wenn ein Nutzer über eine Kampagne auf Ihre Website gelangt, ist diese Kampagne für jede weitere Anfrage weiterhin verfügbar, und zwar solange, bis die Kampagne selbst geändert wird.
- User-Agent: Jede Anfrage eines Nutzers enthält Browserdaten für diesen Nutzer. Diese werden über die Anfrage
HTTP/GETvom Browser gesendet und direkt in der Protokolldatei gespeichert.
Attribution nach Seitenwert
Mit diesem Zuordnungsmodell lässt sich folgende Frage beantworten: "Wie nützlich war meine Seite hinsichtlich eines Zielvorhabens oder eines Umsatzwerts?" Anhand dieses Zuordnungsmodells wird der Seitenwert für eine Seite oder eine Gruppe von Seiten bestimmt. In der folgenden Abbildung sehen Sie eine Prognose für mögliche Seitenaufrufe durch Nutzer in Relation zu Zielvorhaben und Käufen.

Dieses Zuordnungsmodell wird als "Prognose"-Zuordnungsmodell bezeichnet, da es Seiten anhand einer Prognose basierend auf den Zielvorhaben und/oder Käufen, die nach einem Seitenbesuch auftreten, einen Wert zuweist. In der folgenden Tabelle sehen Sie die den einzelnen Seiten nacheinander zugeordneten Werte:
| Seite | Umsatz pro Zielvorhabenwert |
|---|---|
| P1 | 55 € + Zielvorhaben 1 |
| P2 | 55 € + Zielvorhaben 1 |
| P3 | 35 € + Zielvorhaben 1 |
| P4 | 0 € |
Dieses Zuordnungsmodell wird nicht in Berichten zu Zielvorhaben und E-Commerce verwendet, da in diesen Berichten keine Seiten-URIs oder Titel in Verbindung mit E-Commerce-Aktivitäten angezeigt werden.
Site Search-Attribution
Über dieses Attributionsmodell können in Site Search-Berichten Raten der Zielvorhaben-Conversion und Zielvorhabenwerte pro Suchbegriff angezeigt werden.
Dieses Zuordnungsmodell funktioniert anders als die Zuordnung nach Seitenwert, da der Zielvorhabenwert demjenigen Suchbegriff zugeordnet wird, der kurz vor einer Conversion verwendet wurde, nicht danach. In der folgenden Grafik sehen Sie eine Abfolge interner Website-Suchanfragen sowie die zugehörigen Seitenaufrufe und Käufe.

Anhand dieses Modells sind die dem Zielvorhaben 1 zugeordneten Suchbegriffe und Transaktionen folgende:
- Schuhe: 20 €
- Blumen: 25 €
In diesem Modell werden Transaktionen und Zielvorhaben den Suchbegriffen sofort vor dem jeweiligen Zielvorhaben oder der jeweiligen Transaktion zugeordnet.
