You can use a comparison chart to compare a single metric across all your apps, ad units, ad formats or the countries your users are in.
Each comparison chart can display up to eleven lines. The first five lines represent the top five items within the selected comparison dimension. The top five are selected by default. Click See more to view the top 10 items and remaining Other items. The Other line represents the total of all other items within the dimension.
The meaning of each line is displayed in the legend below the chart. Hover over the lines to view the values that they represent.

Comparison chart settings
The settings selected for a comparison chart are displayed in the title and drop-down menu labels. They represent the dimensions and metrics used to organise the data in the chart.
- Comparison metric: The metric used to create the chart before converting it into a comparison chart. To edit the comparison metric, click the Edit chart
icon. The available comparison metrics are displayed in the drop-down menu for Metric 1
- Comparison dimension: The dimension used to divide the data in the chart, represented by multi-coloured lines that correspond to the legend at the bottom of the chart.
- Sort order: The order the data in the chart is presented in; currently "Top" is the only option and is selected by default.
- Sort metric: The value being measured, represented by the points on the lines and the numbers on the left-hand side of the chart.

Examples
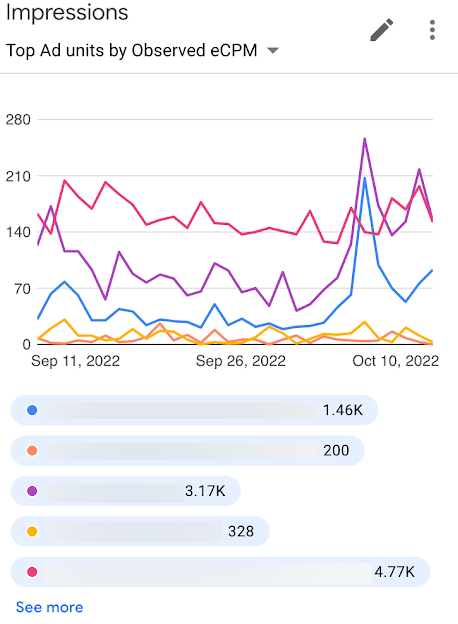
Compare impressions from ad units with the observed eCPM
Create a chart that compares the impressions from ad units with the observed eCPM. Review what ad units are likely to generate the most revenue.
Settings
- Comparison metric: Impressions
- Comparison dimension: Ad unit
- Sort order: Top
- Sort metric: Observed eCPM
Chart
Compare estimated earnings from countries with the highest estimated earnings
Create a chart that compares the estimated earnings from the various countries that your apps are used in. Find out where your apps are most profitable.
Settings
- Comparison metric: Estimated earnings
- Comparison dimension: Country
- Sort order: Top
- Sort metric: Estimated earnings
Chart

Compare impressions from ad sources with the most impressions
Create a chart that compares the impressions from the ad sources that generate the most impressions. Discover which ad source is viewed the most by your users. The Ad sources dimension is only available in the Mediation report and saved reports created from it.
Settings
- Comparison metric: Impressions
- Comparison dimension: Ad source
- Sort order: Top
- Sort metric: Impressions
Chart

Compare impression CTR from apps with the most impressions
Create a chart that compares the impression CTR from your apps that generate the most impressions. Find out which of your apps has the highest click-through-rate.
Settings
- Comparison metric: CTR %
- Comparison dimension: App
- Sort order: Top
- Sort metric: Impressions
