Reports in budget management include a budget pacing chart and performance metrics for all of the budget groups in an advertiser to enable you to look for opportunities to adjust spend. You can see, at a high level, how your budget groups and plans are doing and whether spending is on track. Then you can drill into the data to view spend in each budget group and within plans.
The budget management report includes the following components for manually-managed spend and spend that is managed automatically by budget bid strategies.
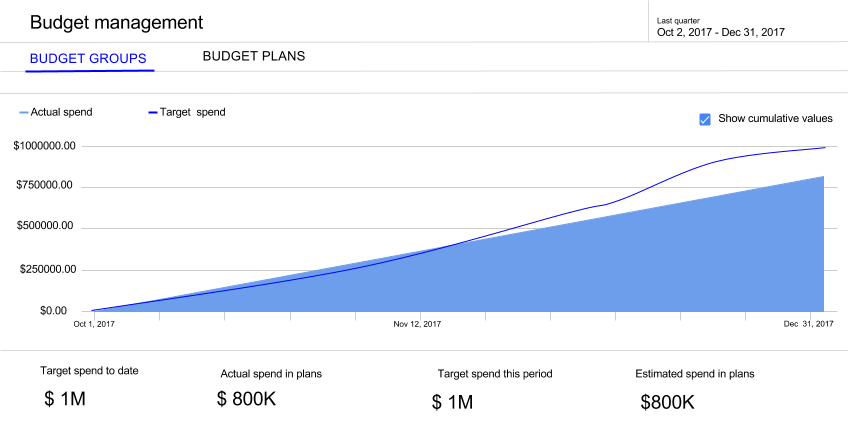
- A graph shows actual, estimated, and target spend for all the campaigns in budget groups, even if budget plans haven't been applied to the groups.
- The amounts below the graph are the totals from all budget plans:
- Target spend to date is the amount of spend that has been allocated in plans up to the current date.
- Actual spend in plans is the actual amount spent in budget plans during the selected date range.
- Target spend this period is the amount that has been allocated in budget plans for a selected date range.
- Estimated spend in plans is the total amount predicted to be spent in budget plans for the selected date range.
- A reporting table that shows the metrics for each budget group, aggregated from the campaigns in the budget group.
You can also view all the budget plans that have been set up in the budget groups.
View changes to budget groups and plans in "Change history"
- Campaigns added or removed from budget group by a user or bulksheet upload.
- Budget group name changed by user.
- Budget changes. Shown as "Budget increased" or "Budget decreased" by budget management.
- Budget bid strategy changes to bids. Shown as "Bid decreased" or "Bid increased" by the bid optimization system.
- Bid adjustment changes. Shown as "Bid modifier added", "Bid modifier removed", "Bid modifier decreased", and "Bid modifier increased" by the bid optimization system.
Report on all budget groups
- Navigate to an advertiser.
Steps for navigating to an advertiser
-
Click the navigation bar to display navigation options.
-
In the "Agency" list, click on the agency that contains the advertiser. You can search for an agency by name or scroll through the list.
-
In the "Advertiser" list, click on the advertiser.
-
Click Apply or press the Enter key.
Search Ads 360 displays the advertiser page, which contains data for all of the advertiser’s engine accounts.
-
- In the left navigation panel, click Budget management.
- Click the Budget groups tab.
By default, the graph shows the aggregated spend for all budget groups for the past 30 days.
The table lists metrics for each budget group. - Optional. In the upper right corner of Search Ads 360, select a time range.
You can scope the budget report to include metrics only for plans that are running:
- In the date selector, click the arrow
next to the time range.
- Under "Time range", click the arrow
- Scroll to the bottom of the list and then select All plans in progress.
- In the date selector, click the arrow
- Options for viewing data and configuring the report:
- Hover over the graph to compare actual, estimated, and targeted spend on a specific date.
Actual spend is shown only for past dates.
Estimated spend is shown only for future dates. - Click the more icon
. Clear the Show cumulative amounts check mark to view spend segmented by date range.
The length of the individual date segments is based on the date range that you are viewing. For example, if the selected time range is a week, the date segments are one day. - Filter, segment the report by device or dates, and add columns to the report.
- Download the report for offline viewing.
- Hover over the graph to compare actual, estimated, and targeted spend on a specific date.
Report on a budget group
The performance of a budget group is shown in a couple of different cards on the budget group's "Overview" tab. The report will include other cards if you selected reporting-only goals in budget plans.
Each card includes 2 graphs that include actual or estimated spend and revenue and target spend and revenue and a table of totals allowing you to compare actual, estimated, and targeted numbers for manual and automatic spend.
"Target spend" chart
Chart 1:
At the top of the card is a graph that shows actual or estimated spend relative to the target spend for the budget group. The graph indicates, in percentages, whether actual or estimated spend exceeds, matches, or is less than the target spend.

Chart 2:
The "Target spend" chart is similar to the chart for all of the budget groups in that it graphs target, estimated, and actual spend.
Table:
The amounts in the table summarize the spend in the campaigns in the budget group:
- Target spend to date is the amount of spend that has been allocated in plans up to the current date.
- Actual spend in plans is the actual amount spent in budget plans during the selected date range.
- Target spend this period is the amount that has been allocated in budget plans for a selected date range.
- Estimated spend in plans is the total amount predicted to be spent in budget plans for the selected date range.
"Conversion goal" chart
The "Conversion goal" chart visualizes the performance of the selected conversion goal. By default, the graph shows the cumulative number of clicks, conversions, or revenue for the selected date range.
Chart 1:
At the top of the chart is the graph of the actual or estimated performance (ROAS, ERS, CPC, CPA) metric relative to the target efficiency metric.
Chart 2:
The lower graph shows actual or estimated conversions, revenue or clicks relative to the target goal.
Table:
The amounts in the table summarize the revenue, or the total number of conversions or clicks in the campaigns in the budget group:
- Target goal to date is the total goal that has been achieved in plans up to the current date.
- Actual goal in plans is the actual goal achieved in budget plans during the selected date range.
- Target goal this period is the desired goal specified in budget plans for a selected date range.
- Estimated goal in plans is the total goal predicted in budget plans for the selected date range.
View a budget group report
- Navigate to an advertiser.
Steps for navigating to an advertiser
-
Click the navigation bar to display navigation options.
-
In the "Agency" list, click on the agency that contains the advertiser. You can search for an agency by name or scroll through the list.
-
In the "Advertiser" list, click on the advertiser.
-
Click Apply or press the Enter key.
Search Ads 360 displays the advertiser page, which contains data for all of the advertiser’s engine accounts.
-
- In the left navigation panel, click Budget management.
- Optional. In the upper right corner of Search Ads 360, select a time range.
You can scope the budget report to include metrics only for plans that are running:
- In the date selector, click the arrow
- Under "Time range", click the arrow
- Scroll to the bottom of the list and then select All plans in progress.
- In the date selector, click the arrow
- Click the Budget groups tab.
You can filter the list to find the budget group that you want. - Click a budget group.
The "Overview" tab displays charts for the target spend, the conversion goal, and any reporting-only goals selected in the budget plans. - Optional. On each chart, click the more icon
- Optional. To view metrics for all the budget plans in the group, click the Budget plans tab.
Notice a difference in the metrics reported for budget plans and campaigns?
Differences in the metrics reported for budget plans and campaigns might be the result of conversion delays and the selected time range. A conversion delay occurs when a click and the conversion attributed to the click occur on different days. Metrics are attributed to budget plans (and budget groups) only when a conversion occurs, but are reported based on the selected time range. Learn more.
Next steps