A data source provides the data for a Looker Studio report. In this lesson, you'll create a data source that connects to one of your own Google Sheets.
In this article: Prepare your data
Follow these tips to make working with your Sheets data in Looker Studio easier:
Use a separate worksheet for Looker Studio data
Spreadsheets let you store and analyze your data in a flexible format that might be difficult to model in Looker Studio. We recommend creating a separate worksheet for the data you want to see in Looker Studio.
='Worksheet 1'!A1 - copies the contents of cell A1 in Worksheet 1.Table format
- The worksheet or range you connect to should have a simple tabular format. Each column should contain only single cells: merged cells may cause your data to appear incorrectly.
- Cells should only contain data: you can't import graphs or images, for example.
- The first row of the worksheet provides the field names in your data source.
Date format
- Dates in your Google Sheet should contain the full day, month, and year, for example, 9/22/2020 or 2020-09-22.
-
If you have time data, it should be combined with the date field, for example, 9/22/2020 11:55:30.
- Date fields should be formatted as dates (using the Format > Number > Date menu option in Sheets).
Other ways of handling dates are possible, but may require more work on your part.
Learn more about handling dates and times in Looker Studio.
Data structure
Organizing your data in certain ways can make it easier to work with in Looker Studio. For example:
Long is better than wide. Limit the number of dimensions by grouping data into categories, rather than having columns for each possible value. For example, if you are measuring sales of fruit from a grocery store, doing this:
| Date | Fruit | Quantity Sold |
|---|---|---|
| 2017-07-06 | Apples | 100 |
| 2017-07-06 | Oranges | 75 |
| 2017-07-06 | Bananas | 150 |
| 2017-07-07 | Apples | 80 |
| 2017-07-07 | Oranges | 95 |
| 2017-07-07 | Bananas | 175 |
Long table example
...is better than this:
| Date | Apples | Oranges | Bananas |
|---|---|---|---|
| 2017-07-06 | 100 | 75 | 150 |
| 2017-07-07 | 80 | 95 | 175 |
Wide table example
In the long table example, your data source only requires one dimension for the Fruit category, whereas the wide table example requires one dimension for each type of fruit. If you sold 100 varieties of fruit, you'd need 100 dimensions to measure them all using the second example. This would be impossible to display in a Looker Studio chart.
Grouping your data series into dimensions also makes filtering in Looker Studio easier. For example, in the long table example, it's easy to build a filter on Fruit = "Apples." In the wide table example, you can't filter by type of fruit.
Understand your aggregations. If your Sheet includes aggregated data, such as sums, averages, medians, etc., be careful not to mix that data with unaggregated data in Looker Studio charts. If you do, the numbers in those charts might not be correct. For example, let's say the wide table above included a Totals row:
| Date | Apples | Oranges | Bananas |
|---|---|---|---|
| 2017-07-06 | 100 | 75 | 150 |
| 2017-07-07 | 80 | 95 | 175 |
| Totals | 180 | 170 | 325 |
Wide table with totals
Scorecards in Looker Studio would display inflated numbers for each of the fruit dimensions (because it adds the totals to the un-aggregated metrics):
|
Apples 360 |
Oranges 340 |
Bananas 650 |
|---|
Scorecard examples
In this case, it's best to not include the totals row in the data source and instead, let Looker Studio calculate the totals.
 Connect to Google Sheets
The first step in creating a data source is to connect to your data set.
- Sign in to Looker Studio.
- On the Looker Studio home page, in the top left, click
Create and then select Data Source.
- In the connectors panel, select Google Sheets.
- Select a Spreadsheet and Worksheet.
- Optionally, uncheck Use first row as headers. The fields in your data source will instead use the default Sheets column labels: "A," "B," "C," etc.
- Optionally, uncheck Include hidden and filtered cells. These will now be excluded from the data source
- Optionally, specify a range of cells. Otherwise, the entire worksheet is used.
- Click CONNECT in the upper right. The fields panel appears.
 Configure the data source
The data source configuration page contains all the dimensions (the green chips) and metrics (the blue chips) from the data set. You can fine-tune the data source by renaming or disabling fields, adding calculated fields, and changing the aggregation and data type.
Learn more about modeling your data.
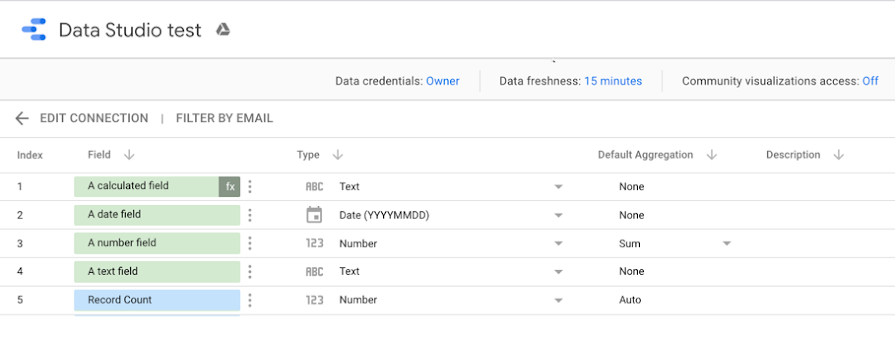
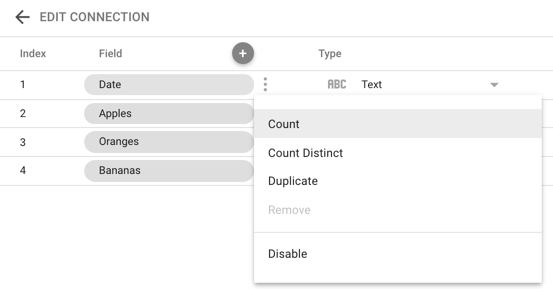
Add a metric
You can add a metric to the data source by clicking next to a dimension and selecting one of the available functions. You'll need at least one metric to chart your data in Looker Studio.
 Rename your data source

Looker Studio automatically names your data source the same as your data set name. If you want to change that, click the name in the upper left and enter a new name.
You can also rename the data source later from the DATA SOURCES home page by clicking the context menu and selecting Rename.
 Share the data source
You can let other editors add this data source to reports by sharing it with them.
To share a data source
-
In the upper right, click
Share.
-
Enter the email addresses or Google Groups that you want to share with.
-
For each person or group, select the access (permissions). Permissions determine what other people can do with the data source. Your choices are as follows:
-
Can view. People with this permission can view but not edit the data source.
-
Can edit. People with this permission can both view and edit the data source.
-
 Use this data source in reports
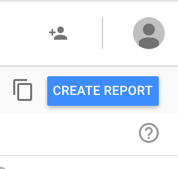
You can now create reports that get their data from your Google Sheet:
- Click CREATE REPORTin the upper right
- You'll see the report editor tool, and a table appears with fields from that data source.
- Use the properties panel on the right to change the data and style.
- In the top left, name your report by clicking Untitled Report.