The Bin calculated field type lets you create ad hoc numeric tiers for numeric dimensions without needing to develop CASE WHEN expressions in calculated fields or logic in SQL.
The Bin calculated field type can be helpful when you want to quickly group values into specific integer ranges to adjust the granularity of your data.
This page provides an overview of how to perform the following tasks:
- Create a custom bin in your data source
- Edit a custom bin in your data source
- Create a chart-specific custom bin
- Edit a chart-specific custom bin
- Reuse a chart-specific custom bin
For more information about custom bins, see the Related resources section on this page and the Create a custom bin example on the About calculated fields page.
Create a custom bin in your data source
Custom bins that are created in data sources are available in any report that uses that data source. To create a custom bin in a data source, follow these steps:
Click
 ADD A FIELD.
Select Add bin.
Select an existing field to bin by from the Selected field to bin by drop-down menu.
Select a format for the bin from the Bin field format drop-down menu. Options include the following:
- Interval "[x,y)" -- This format displays the range that includes x and up to but not including y.
- Integer "x to y" --This format must be used with discrete integer values (such as age).
- Relational ">=x and < y" -- This format is best used with continuous numbers (such as dollars).
Specify a name in the New field name field.
- This name is the default name that appears in your reports. You can change the field name for individual charts by editing the name in the dimension picker.
- The field name must be unique.
- You can't use a reserved keyword as the field name.
Edit the default ID that is provided in the New field ID field, as desired. This ID is used by Looker Studio to identify a field as an alternative to the field name.
As an optional starting point, select Refresh field info to learn more about the values for the dimension for which you're creating custom bins, including the dimension's minimum and maximum values. Having this information can be helpful in determining the way in which you specify value bins.
Specify a Bin type.
- Select Equal Sized to bin numeric values into equal integer ranges. For example, tiers of values that range from 0-10, 10-20, and 20-30.
- Select Custom Sized to create custom bin sizes of varying integer ranges. For example, tiers of values that range from 0-15, 15-75, and 75-100.
Customize the bin sizes and ranges.
- If the selected Bin type is Equal Sized, enter the desired values in the Bin size, Minimum value, and Maximum value fields.
- If the selected Bin type is Custom Sized, specify the tier breakpoints in ascending order in the Bin breakpoints box, separated either by commas or by pressing the Enter key (PC) or Return key (Mac). You can also use the Tab key.
Optionally, select the Bin remaining values outside the min and max as separate bins checkbox to create a category for grouping all other values that don't satisfy any of the group conditions.
Click Save.
Create a custom bin in your data source from a report
Alternatively, you can create a custom bin in your data source from a report by following these steps:
Create or edit your report.
In the Data panel, click
Add a field.Select Add bin.
Select an existing field to bin by from the Selected field to bin by drop-down menu.
Select a format for the bin from the Bin field format drop-down menu. Options include the following:
- Interval "[x,y)" -- This format displays the range that includes x and up to but not including y
- Integer "x to y" --This format must be used with discrete integer values (such as age).
- Relational ">=x and < y" -- This format is best used with continuous numbers (such as dollars).
Specify a name in the New field name field.
- This name is the default name that appears in your reports. You can change the field name for individual charts by editing the name in the dimension picker.
- The field name must be unique.
- You can't use a reserved keyword as the field name.
Edit the default ID provided in the New field ID field, as desired. This ID is used by Looker Studio to identify a field as an alternative to the field name.
As an optional starting point, click Refresh field info to learn more about the values for the dimension for which you're creating custom bins, including the dimension's minimum and maximum values. Having this information can be helpful in determining the way in which you specify value bins.
Specify a Bin type.
- Select Equal Sized to bin numeric values into equal integer ranges. For example, tiers of values ranging from 0-10, 10-20, and 20-30.
- Select Custom Sized to create custom bin sizes of varying integer ranges. For example, tiers of values ranging from 0-15, 15-75, and 75-100.
Customize the bin sizes and ranges.
- If the selected Bin type is Equal Sized, enter the desired values in the Bin size, Minimum value, and Maximum value fields.
- If the selected Bin type is Custom Sized, specify the tier breakpoints in ascending order in the Bin breakpoints box, separated either by commas or by pressing the Enter key (PC) or Return key (Mac). You can also use the Tab key.
Optionally, select the Bin remaining values outside the min and max as separate bins checkbox to create a category for grouping all other values that don't satisfy any group conditions.
Click Save.
See the Create a custom bin example on the About calculated fields page.
Edit a custom bin in your data source
Custom bins and calculated fields appear in the data source with an fx symbol. To edit the formula, click fx next to the field name to open the formula editor, where you can adjust the field as needed.
Create a chart-specific custom bin
Chart-specific custom bins exist only in the chart in which you create them.
To create a chart-specific custom bin, follow these steps:
Create or edit your report.
Add a new chart or select an existing chart.
In the Setup tab of the Properties panel, click + Add dimension.
At the bottom of the field list, click + ADD BIN.
Select an existing field to bin by from the Selected field to bin by drop-down menu.
Select a format for the bin from the Bin field format drop-down menu. Options include the following:
- Interval "[x,y)" -- This format displays the range that includes x and up to but not including y.
- Integer "x to y" --This format must be used with discrete integer values (such as age).
- Relational ">=x and < y" -- This format is best used with continuous numbers (such as dollars).
Specify a name in the New field name field.
- This name is the default name that appears in your reports. You can change this name for individual charts by editing the name in the dimension picker.
- The field name must be unique.
- You can't use a reserved keyword as the field name.
As an optional starting point, click Refresh field info to learn more about the values for the dimension for which you're creating custom bins, including the dimension's minimum and maximum values. Having this information can be helpful in determining the way in which you specify value bins.
Specify a Bin type.
- Select Equal Sized to bin numeric values into equal integer ranges. For example, tiers of values that range from 0-10, 10-20, and 20-30.
- Select Custom Sized to create custom bin sizes of varying integer ranges. For example, tiers of values that range from 0-15, 15-75, and 75-100.
Customize the bin sizes and ranges.
- If the selected Bin type is Equal Sized, enter the desired values in the Bin size, Minimum value, and Maximum value fields.
- If the selected Bin type is Custom Sized, specify the tier breakpoints in ascending order in the Bin breakpoints box, separated either by commas or by pressing the Enter key (PC) or Return key (Mac). You can also use the Tab key.
Optionally, select the Bin remaining values outside the min and max as separate bins checkbox to create a category for grouping all other values that don't satisfy any group conditions.
Click Save.
Edit a chart-specific custom bin
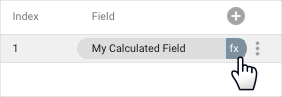
Chart-specific calculated fields appear in the chart Properties panel on the Setup tab.
When you hold the pointer over the field type next to the field name, an fx symbol will appear. To edit the formula, click fx to bring up the formula editor, where you can adjust the field as needed.
Reuse a chart-specific custom bin
Chart-specific calculated fields exist only in the chart in which you create them. You can't directly reuse a chart-specific calculated field or reference it in other calculated fields.
However, you can copy a chart that contains chart-specific calculated fields. The copy will contain any calculated fields that are defined in the original. You can then edit them as needed in the new chart.
Related resources
- About calculated fields
- Create a custom bin example
- Add, edit, and troubleshoot calculated fields
- Edit fields