Jul 5, 2019
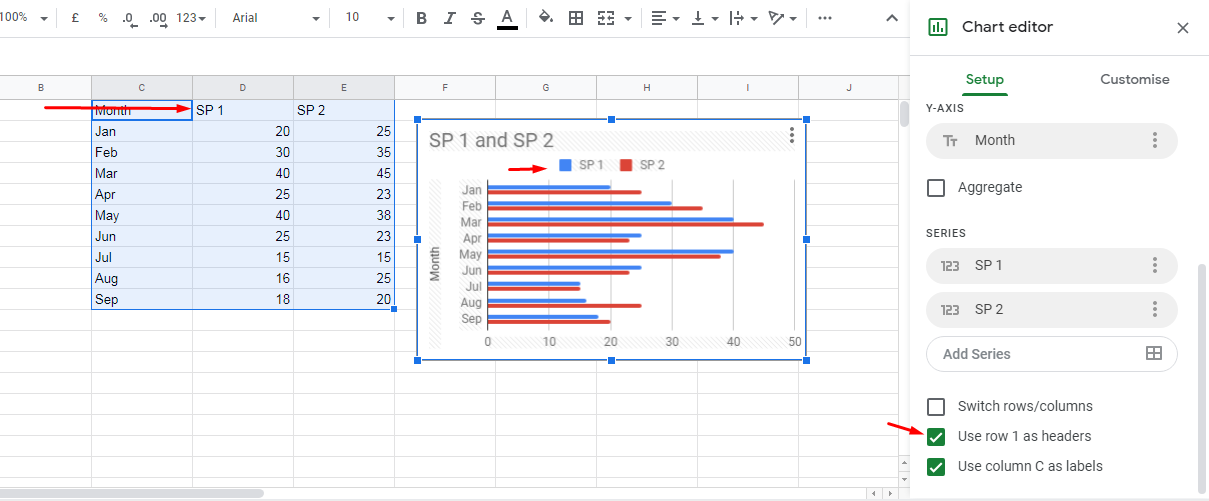
in sheets my graph gives the legend with colours how to I add a name to it?
Details
Informational notification.
This question is locked and replying has been disabled.
Community content may not be verified or up-to-date. Learn more.
All Replies (8)

Jul 8, 2019
Please share an example Sheet.
Best,
Prashanth KV
Jul 29, 2019
Jul 29, 2019
See if this helps?
Best,
Prashanth KV
Dec 31, 2019

Dec 31, 2019
@Ashley Kress Realtor,
No, there is no way to get it to read the tab name and use that as the label. It is best to include the label similar to what Prashanth KV showed, you could do that on each sheet though if your ranges are from different sheets. Or else you could create a summary table on one tab that includes the header/label and the data at the same time.
Feb 14, 2020
Feb 21, 2020
Feb 21, 2020
Everyone in this forum, unless their profile specifically says "Google Employee", is a volunteer, even the Product Experts. As such, we do not have access to internal Google data or systems and are unable to directly help in some types of problems. We try to provide solutions or work-arounds within those limits but are not always able to get something that works for your situation. In those cases, I would encourage you to send a feature request to the developers using the in-product feedback tools (instructions below). Feedback submitted there will go directly to the development team and the more people who request a feature like this the more likely it will be implemented.
- For Docs/Sheets/Slides: You can send feedback from the Help menu > Report an issue. (For some this will be "Help Sheets/Docs/Slides improve" instead.)
- For Mobile: To submit feedback from the mobile app, touch the menu in the top-left of the app (top-right in a file), touch Help & Feedback, and then choose Send Feedback to write and submit your report.