2018 releases
- December 19, 2018
- December 14, 2018
- November 30, 2018
- November 15, 2018
- November 2, 2018
- October 18, 2018
- October 11, 2018
- October 3, 2018
- September 20, 2018
- September 13, 2018
- September 06, 2018
- Aug 30, 2018
- Aug 15, 2018
- Aug 2, 2018
- July 26, 2018
- July 12, 2018
- July 3, 2018
- June 28, 2018
- June 21, 2018
- June 14, 2018
- June 7, 2018
- May 24, 2018
- April 26, 2018
- April 12, 2018
- April 5, 2018
- March 27, 2018
- March 20, 2018
- March 6, 2018
- February 6, 2018
- January 31, 2018
- January 24, 2018
- January 12, 2018
December 19, 2018
Product updates
Community visualizations in developer preview
Developers can now create community visualizations that work with your data and can be configured just like Data Studio's default charts. The feature is now ready for all developers to build and use visualizations in reports. The developer preview program lets developers try out new and cutting-edge features as they are in progress.
Community connectors out of developer preview
Community connectors are now generally available. Community connectors allow anyone to build their own connections to any internet-accessible data source.
Custom SQL support in Cloud SQL connector
You can now use custom SQL statements in the Google Cloud SQL for MySQL connector.
Display & Video 360 data source bug fix
We've fixed a bug that prevented you from creating calculated field dimensions in Display & Video 360 data sources.
December 14, 2018
Product updates
Preset charts and improved chart placement
We've streamlined the way you add visualizations to your reports. You can now choose from a selection of preset charts and add them to the canvas with a single click. The presets include a variety of styling options. For example, you can add a table with a heatmap already applied, or a 100% stacked bar chart. You can also apply different presets to charts that you've already added to the report.
Watch a demo
Chart interaction filters now include brushing
Chart interactions let you turn your charts into filter controls. Brushing allows you to drag your mouse across a chart to select a range of values to filter by. For example, you can use a time series to filter your report by a time frame highlighted on the chart.
Watch a demo
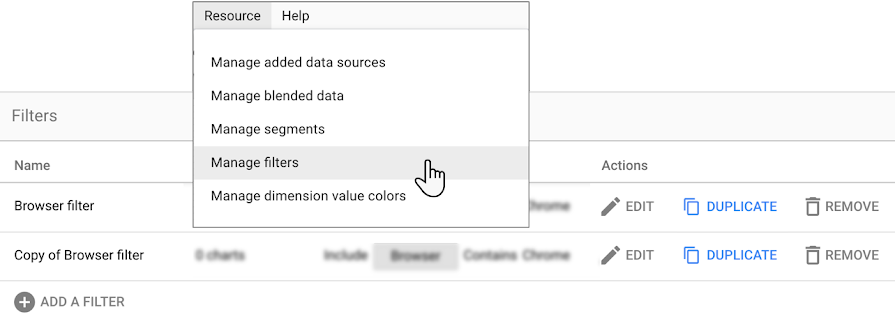
Duplicate filters and blended data sources
You can now copy filters and blended data sources within the same report. To do this, edit your report, then choose the Resource menu and select the resource you want to manage. Use the Duplicate action to make the copy. You can then apply the copied filter or blended data source to other charts in the report.
New options for handling of missing data
Tables and scorecards now provide a Missing data option in the STYLE properties panel. When your data is missing values, charts can display 0, No data, - (hyphen), or null.
November 30, 2018
Product updates
Embed external content in your reports
You can now add content hosted on other sites in your reports. Using the URL embed feature, you can include YouTube videos, web pages, and Google Docs to create robust multi-media experiences for your viewers.
PDF download improvements
We've fine-tuned PDF download to better support larger reports and reduce time-out errors.
November 15, 2018
Product updates
The Ad Manager 360 connector lets you visualize over 50 Ad Manager fields directly in Data Studio. Google Ad Manager is a comprehensive hosted ad serving platform that streamlines your ad management, whether you deliver ads to websites, mobile webpages, mobile apps, games, or a combination of these. Learn more about Google Ad Manager.
November 2, 2018
Product updates
Chart-specific calculated fields
You can now add calculated fields directly to a chart in your report. Chart-specific calculated fields let report editors create fields that use the same features as calculated fields in data sources. In addition, chart-specific calculated fields work on blended data.
To create a chart-specific calculated field, select a chart and click +Add dimension or +Add metric in the DATA properties panel.
Chart interactions
You can now turn your charts into interactive filters. Viewers can click a dimension value in one chart to filter other charts on the page by the selected value.
Search All filter control
In addition to the familiar list style filter control, you now have a new option: Search All. Report viewers can use advanced search options to filter the report.
Updated dimension and metric picker
It's now easier to find and select dimensions and metrics in the component properties panel. When you click a field chip in the right-hand properties panel, the picker now shows field groupings, if available. In addition, you can use both your mouse and keyboard to scroll through the list.
Multi-select improvements
You can now resize multiple components at the same time. Just select the charts, controls, images, or shapes you want to resize, then drag a selection box corner to adjust the size.
We've also made it easier to select, move, and resize components that are partially hidden by other components.
Watch a demo
October 18, 2018
Product updates
- We've added over 2 dozen fields to the Search Ads 360 connector. To use these fields, create a new Search Ads 360 data source, or refresh an existing data source.
- We've made Undo / Redo in the report editor more reliable.
October 11, 2018
Product updates
This week's features have been postponed temporarily.
October 3, 2018
Product updates
- You can now download reports as PDF. You can save all pages of the report, or select the pages you want to download and determine their order. Saved reports can include a link back to the report in Data Studio, and you can add password protection to keep your data private.
- We've added new "to date" options to date ranges. These new options let you set a rolling time period without needing to manually update the date range. You can now select from:
- Week to date (Starts Sunday)
- Week to date (Starts Monday)
- Month to date
- Quarter to date
- Year to date
September 20, 2018
Product updates
- Data Studio is no longer in beta.
- Calculated fields now support literal negative numbers, for example: Metric * -1.
September 13, 2018
Product updates
Google Marketing Platform users can now access their Data Studio reports from within GMP products. GMP users will see their Data Studio reports in the Analytics, Optimize and Tag Manager headers. Simply click on the Data Studio icon to see a list of recent reports or use the search functionality within the header to find a specific report.
September 06, 2018
Product updates
- You can now create data sources based on extracted data. Extracted data sources provide faster performance because the data is static until you refresh it. Learn more.
August 30, 2018
We've improved error messaging in Community Connectors. If you experience connection issues with a third party connector, you'll see error details and support links to help you resolve the issue.
August 15, 2018
Product updates
You can now copy and paste chart and control styles. This makes it easier to create consistent looking reports.
August 2, 2018
Product updates
- You can now connect Data Studio to more Google Marketing Platform products:
- Display & Video 360 is the evolution and consolidation of DoubleClick Bid Manager, Campaign Manager, Studio, and Audience Center. Learn more about the Display & Video 360 connector.
- Search Ads 360 is a search management platform that helps agencies and marketers efficiently manage some of the largest search marketing campaigns in the world, across multiple engines and media channels. Learn more about the Search Ads 360 connector.
- The BigQuery connector now supports explicit data locations. Learn more.
Documentation updates
We've added new template reports for Display & Video 360 and Search Ads 360 to the Report Gallery.To use these templates with your own data, preview the report with the links below, then click USE TEMPLATE. You can add your own data source and have a functional report in under a minute.

|

July 26, 2018
Product updates
- Data Studio is now part of Google Marketing Platform. We’ve unified our DoubleClick advertiser products and the Google Analytics 360 Suite under a single brand: Google Marketing Platform. As part of the launch of Google Marketing Platform on July 24, Google Analytics 360 Suite Home has become Platform Home.
Data Studio's functionality and availability are not affected by these changes. You will, however, see the new Google Marketing Platform brand - including new product names and logos - reflected in product interfaces, help centers, trainings, and more. Learn more.
- You can now share a direct link to your Community Connector. When a user follows the link, it will take them directly to Data Studio with your connector selected. Learn more.
Documentation updates
You'll notice a fresh new look for all the Google Help Centers, based on Material Design. The new design has been optimized for mobile and delivering a better experience for users around the globe.
July 12, 2018
Product updates
You can now blend data from multiple data sources. For example, you can blend two different Google Analytics data sources to measure the performance of your app and website in a single visualization. You can blend data from different kinds of data sources, as long as there is at least one common field with which to join the data. Learn more about data blending.
Share your data stories on social media platforms like Twitter, LinkedIn, Facebook, Google+, or on chat applications like Hangouts, or iMessage. Learn more about sharing on social media.
July 3, 2018
Product updates
The Search Console connector now gives you access to up to 16 months of data. This data is also available in the Search Console interface (see the blog post), and in the Search Console API (tweet).
June 28, 2018
Product updates
- We've made 2 improvements to calculated fields:
- Messages for the most common errors are now more informative.
- You can now format your formulas automatically with the FORMAT FORMULA button:
- You can now use SVG images in your reports.
June 21, 2018
Product updates
- You can now have more data in your charts. Most charts now allow up to 20 dimensions and 20 metrics. Time series support up to 20 metrics. Tables support 10 dimensions and up to 20 metrics. Pivot tables, scorecards, and bullet charts are unchanged.
- You can now change the grid size in the report editor. This makes it easier to create standardized report layouts. The new Grid Settings options are located in the Layout and Theme panel.
- We've built an example report to demonstrate how you can use the grid. Check it out!
- You can now embed Data Studio reports in social media platforms, such as Reddit and Medium, that use the oEmbed format. Learn about more embedding.
-
Community connectors now support username/password, and API Token authentication. Learn more.
June 14, 2018
Product updates
- You can now generate thumbnail images for your reports using the new /thumbnail URL endpoint. Thumbnails are useful for showing viewers a preview of the report's first page. Use them when sharing reports via email, embedding in a website or blog post, etc. Learn more about thumbnail images.
-
We've changed the default metric aggregation for "flexible schema" data sources. (These are data sources based on data sets where we can't know the schema ahead of time, such as Sheets and BigQuery.) In the past, metrics in those data sources defaulted to aggregation type
Sum. They will now default to aggregation typeNone. This should have no effect on your reports, as the default aggregation of a metric in a chart is stillSum. And as before, you can override the default aggregation in the data source or by editing the fields in the report.In addition, you'll notice new metric icons indicating the aggregation type in your chart configuration:
Icon label Aggregation AUT Auto SUM Sum AVG Average MIN Min MAX Max CT Count CTD Count Distinct
-
Documentation and help updates
We've add an example reports article to the Help Center. This page curates a number of demonstration and example reports you can use to see Data Studio features in action.
June 7, 2018
Product updates
- You can now apply running calculations to metrics in your reports. Running calculations compute summary results for each record of data, helping you see how each contributes to the whole picture. Learn more or view a sample report.
- You can now access the Product Overview, Report Gallery, and Connector Gallery from the left-hand navigation in the Data Studio Home page.
- BigQuery data sources now automatically provide a default Record Count metric. You can use this as a breakdown dimension to show the number of records being aggregated by your charts.
May 24, 2018
Product updates
- We've added some features to Cartesian charts:
- You can now control the display direction of the X and Y axes in area, bar, combo, scatter, and time series charts. In the chart's STYLE properties, under Axes, use the checkboxes to reverse the display order of each axis. See a demonstration.
- Combo charts now support stacked bars.
- 3rd party connectors now support passing parameters from reports to the data source. This makes reports based on these connectors more flexible. Learn more.
April 26, 2018
Product updates
- You can now connect to Google Cloud Spanner databases. Cloud Spanner is an enterprise-grade, globally-distributed, and strongly consistent database service that combines the benefits of relational database structure with non-relational horizontal scale. Learn more.
- Pivot tables now let you include up to 10 metrics in your analysis.
April 12, 2018
Product updates
You can now toggle table headers on or off using the Show header option (located in the table properties STYLE panel). Learn more about tables.
April 5, 2018
Product updates
We've launched a new connector gallery. It's now easier to find and access both Google and Community connectors. To see the connector gallery, create a new data source.
March 27, 2018
Product updates
- As a part of the General Data Protection Regulation (GDPR), you can now review and accept the Data Processing Terms, as well as supply contact information and company details, by going to
User Settings > Account & Privacy in Data Studio. Learn more about the GDPR.
- The list of available spreadsheets should now load faster when creating Google Sheets data sources.
March 20, 2018
Product updates
You can now bookmark a report and preserve its filter settings. This lets you create custom views of your data, as well as specify default settings for multi-select filters.
March 6, 2018
Product updates
- We've improved the calculated fields editor with a larger text box and drag-and-drop field selection.
- Switching chart types now better preserves style settings.
February 6, 2018
Product updates
- You can now configure charts more efficiently by dragging and dropping fields in the report editor properties panel. Learn more by watching this video.
- You can now connect securely to PostgreSQL using SSL.
January 31, 2018
Product updates
You can now access the following new fields in YouTube data sources:
- Video Link—provides a clickable link to open the video in new tab
- Thumbnail Link—provides a clickable link to open the thumbnail image in new tab
- Thumbnail—displays the video thumbnail image
- Linked Thumbnail—displays a clickable image of the video thumbnail, which opens the video in new tab
These fields appear automatically in new data sources. To add them to an existing data source, edit the data source, then click REFRESH FIELDS. Learn more.
In addition, for new data sources, the Video Length field is now a metric, with an aggregation of AVERAGE. (This change will not be applied to existing data sources, even if you reconnect them.)
January 24, 2018
Product updates
- You can now include up to 3 pivot tables per report page. (The previous limit was 1 pivot table per page.)
- We've fixed a bug in the COUNT_DISTINCT function. The function now works correctly when filters and date ranges are applied to the data.
January 12, 2018
Product updates
- You can now sort data in charts based on any metric in your data source, even if that field is not in the chart. You can also change the aggregation of the sort fields (the same way you can with other fields in the chart). Learn more.
- We've fixed a bug in the PERCENTILE function. When using BigQuery Legacy SQL, the function was using the N-1th percentile calculation. The function now correctly uses the Nth percentile.