You can use Looker Studio to visualize and compare dates and times in charts and graphs, and let users adjust the report's date range. You can also use date functions in calculated fields to manipulate and transform date and time data.
In this article:Date and time data types
Looker Studio supports the following calendar date and time data types:
| Type | Example data |
| Date | Sep 15, 2020 |
| Date & Time | Sep 15, 2020, 6:10:59:59 PM |
| Year | 2020 |
| Year Quarter | Q3 2020 |
| Year Month | Sep 2020 |
| ISO Year Week | Sep 14, 2020 to Sep 20, 2020 (Week 38) |
| Date Hour | Sep 15, 2020, 6 PM |
| Date Hour Minute | Sep 15, 2020, 6:10 PM |
| Quarter | Q3 |
| Month | September |
| ISO Week | Week 35 |
| Month Day | Sep 15 |
| Day of Week | Tuesday |
| Day of Month | 23 |
| Hour | 6 PM |
| Minute | 52 |
You can change a field's data type in the data source:
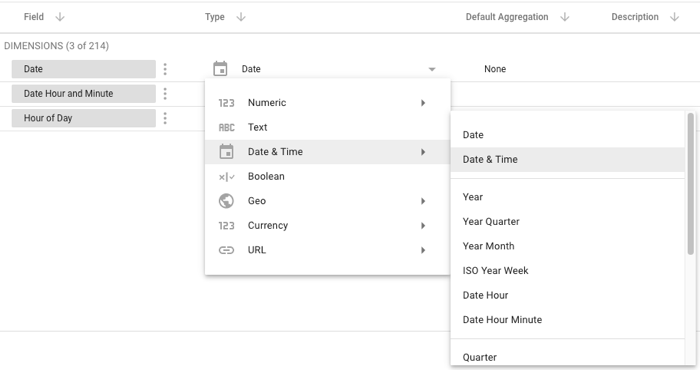
and in a specific component:

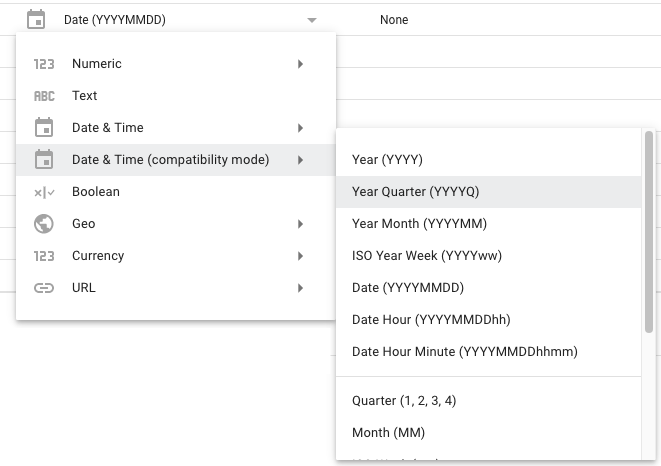
Date & Time (compatibility mode)
Date and time dimensions in data sources created before September 15, 2020 use a Date & Time (compatibility mode) data type. Compatibility mode dates include the format or an example in the name, as shown below:
Compatibility mode dates have both a Type and a Granularity option when editing the field in charts. To adjust a chart's date grouping, use Granularity.
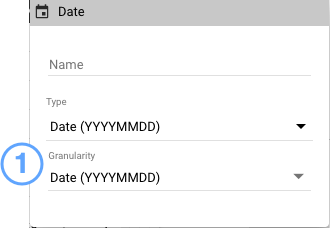
- The Granularity menu.
Upgrade a compatibility mode date field
Compatibility mode dates continue to work in your existing components and calculated fields. However, you can't use compatibility mode dates with all of the available date and time functions. To use those functions, you can upgrade your date fields to new Date or Date & Time data types.
When you upgrade a compatibility mode date to a new Date or Date & Time type:
- You can use the upgraded field with functions such as
DATETIME_ADD,DATETIME_DIFF,EXTRACT, and more. - Calculated fields and filters that expect a specific data format might fail, due to the new data type's formatting. You can fix any broken components by adjusting the formulas or filters to use the upgraded field's new format.
- You can't change a Date or Date & Time field to compatibility mode. The compatibility mode type is turned off for upgraded fields.
- If you decide you want to undo the change, use version history in the data source to restore an earlier version.
To upgrade:
- Sign into Looker Studio.
- Edit your data source.
- Locate the compatibility mode date field you want to convert.
- To the right, click the Type menu, then select Date or Date & Time.
- Select the desired date type.
- In the dialog box that appears, click UPGRADE.
Because upgrading might impact your reports, you must upgrade date and time fields individually. Reconnecting your data source won't upgrade the fields.
The following connectors don't support the new Date and Date & Time data types, so you can't upgrade to or create those types in data sources using these connectors:
- Cloud Spanner
- YouTube Analytics
- BigQuery using Legacy SQL
Use dates and times in charts
You can group (aggregate) the data in your charts by different levels of date granularity according to the date field's data type. For example, adding a Date field to your chart groups the data by year, month, and day. To group the data by month, change type to Month, or use a Month field from your data source.

- Chart showing Metric by full date.
- Chart showing Metric by month.
Change the data type in a chart vs. the data source
Changing a field's data type in the data source changes that field everywhere it's used. This may also limit how you can use that field in charts.
Best practice
Always have a full Date or Date & Time field in your data source. Use that field in your charts and adjust the field's type in the chart:
- Edit your report.
- Select the chart.
- Hover over the date field, then click
Edit.
- Select the new field type.
Use dates and times in calculated fields
You can use functions in calculated fields to create new columns of date and time data in your data source or directly in components on the report.
For example, you can construct a complete date from separate numeric day, month, and year fields using the DATE function. You can extract date and time parts from a date with functions like YEAR, DAY, and HOUR. You can calculate the difference between 2 dates using DATETIME_DIFF, or add a certain number of time parts using DATETIME_ADD.
Learn more about date and time functions.
Date and Date & Time literals
To use literal date and time values in a calculated field, you can precede the value with the appropriate marker:
| Literal | Canonical data format |
DATE |
'YYYY-[M]M-[D]D' |
DATETIME |
'YYYY-[M]M-[D]D [[H]H:[M]M:[S]S]' |
Examples:
Calculate the difference between a date from data and a specific fixed date:
DATETIME_DIFF(date_field, DATE "2008-12-25", DAY)
Format a date as text:
FORMAT_DATETIME("%x", DATE "2008-12-25")