The data control lets you select the data set used by a report without having to edit the data source connection.This makes it easy for you to share reports with viewers who want to use that report with their own data. Using a data control eliminates the need to create separate reports and data sources for your various accounts.
In this article:How the data control works
The data control allows a report viewer to change the data set used by a specific type of data source. To understand how this works, it's helpful to review how reports without a data control behave:
Without a data control, each data source in the report connects to a specific data set. For example, a Google Analytics data source connects to a single Analytics reporting view, a Google Ads data source connects to a single account or manager account, etc. Every chart or control in the report gets its data from that one specific data set. The only way the report can display different data is to edit it and select a different data source, or to reconnect the data source to a different data set.
When you add a data control of a particular type, the original data set remains as the default. But, anyone viewing the report can use the data control to change to a different data set to which they have access.
Note: Data controls only show the accounts to which you have access.
The data control doesn't give you access to other people's data. As always, access to data is governed by the credentials of the data source.
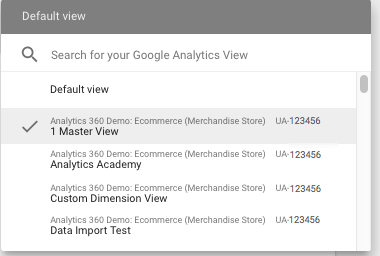
Example
You can have multiple data controls in a single report. The data control currently supports these data sets:
- Google Analytics (Universal Analytics and Google Analytics 4)
- Google Ads
- Attribution 360 (TV Attribution)
- Google Ad Manager
- Campaign Manager 360
- Search Console
- YouTube
Data control scope
By default, a data control of a given connector type affects all the charts on the current page that are based on that type. For example, a YouTube data control affects all the charts based on a YouTube data source, a Search Console data control affects the charts based on a Search Console data source, etc. Just like filter controls and date range controls, you can limit the scope of a data control so that it affects only charts grouped with the data control. This lets you use multiple groups of data controls and charts to display data from different accounts on the same page.
To have a data control affect the entire report, make it a report-level component. The data control then appears on every page.
Bookmark a view
The data control stores the currently selected account in the URL, allowing you to save the configuration by bookmarking the current report. This makes it easy to return to a particular version of the report or share that version with others by sending them the bookmarked link.
Use Cases
Support cross-functional use of data
Suppose your organization tracks digital analytics for distinct Marketing and Sales websites, and a Support mobile app. You could build a single default report to be shared across your organization and include a data control in the report. Users in each department could use data controls to select the Analytics and Google Ads accounts that are relevant to them.
Help new users see their data in Looker Studio
Even if someone doesn't know how to use Looker Studio, any report that includes a data control can show them their own data. This makes it easy to create public reports which the user can then adapt to their own data. When the user first comes to Looker Studio, they are prompted to authorize access to the relevant accounts. They can then use the data controls you've placed on the report to select one of their own accounts.
Limits of the data control
- If someone switches to a data set that doesn't contain the metrics or dimensions used in your charts, they will see errors in those charts. For example, if you include a custom dimension from Google Analytics in your chart, but the user switches to a view that doesn't contain that custom dimension, the chart may break.
- Data controls do not work in embedded reports.