Calculated fields let you create new metrics and dimensions that are derived from your data. Calculated fields let you extend and transform the information that flows from your data sources and see the results in reports.
In this article:Watch a video
How calculated fields work
A calculated field is a formula that performs some action on one or more other fields in your data source. Calculated fields can perform arithmetic and math; manipulate text, date, and geographical information; and use branching logic to evaluate your data and return different results. You can also create custom groups with the custom group calculated field type. The output of a calculated field can then be displayed for every row of data in charts that include that field. How this new data is displayed depends on how it's used.
For example, say you create a calculated field called Total that multiplies a unit price field (Price) by a quantity sold field (Qty Sold):
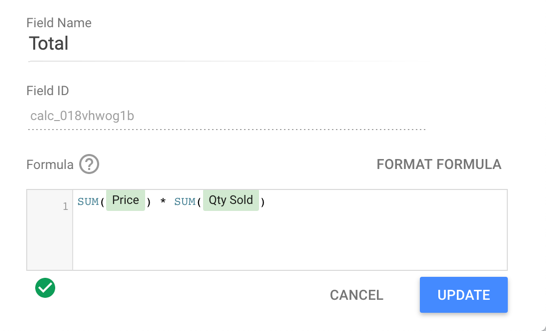
When used in a table, the calculated Total field shows the product of that multiplication for each row.

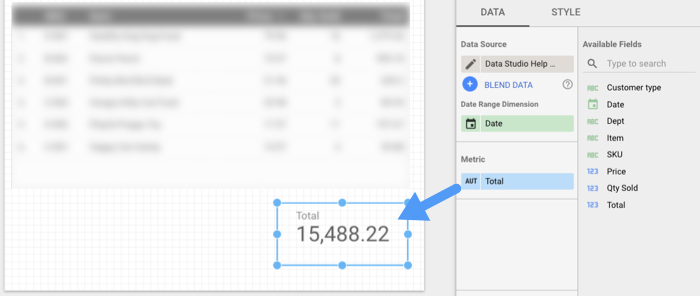
When used in scorecard, the Total field displays the sum of the products for all rows in which quantity is multiplied by price.
Data source versus chart-specific calculated fields
There are two kinds of calculated fields, which are determined by where you create them: in the data source, or in specific charts in a report. Each kind of calculated field offers certain advantages over the other.
Calculated fields in data sources
When you create a calculated field in a data source, the following actions are available:
- The calculated field is available in any report that uses that data source.
- You can use a data source calculated field in charts, controls, and other calculated fields, just like a regular field.
- You can filter on a data source calculated field, just like a regular field. For example, you could set a filter property to include only items with a combined value of $500 or more:

Limits of data source calculated fields
Calculated fields in data sources have the following limitations:
- You can't use a data source calculated field with blended data.
- You must have edit rights to the data source to create or edit calculated fields there.
- You cannot apply custom value formatting when you create or edit a calculate field in a data source. You can apply custom value formatting to a data source calculated field in the Setup tab of a chart's Properties panel.
Chart-specific calculated fields
You can add calculated fields directly to a chart in your report. These chart-specific (also known as "chart level") calculated fields can do math, use functions, and return results-based CASE statements, just like calculated fields in a data source.
Chart-specific calculated fields offer some advantages over data source calculated fields:
- You can quickly and easily add fields without needing access to the data source.
- You can create chart-specific calculated fields that are based on blended data.
- You can include data source calculated fields in chart-specific calculated fields.
- You can apply custom value formatting to a chart-specific calculated field during the creation process.
Limits of chart-specific calculated fields
- Chart-specific calculated fields only exist in the chart in which you create them. Creating a field in the chart does not also create it in the chart's data source.
- You can't reference other chart-specific calculated fields in your formula, even if those fields are defined in the same chart. (If you need to reference other calculated fields, use a data source calculated field.)
- To be able to create chart-specific calculated fields, you must be an editor of the report.
- Field Editing in Reports must be enabled in the data source.
The following table summarizes the differences between these 2 kinds of calculated fields.
| Feature | Data source calculated fields | Chart-specific calculated fields |
|---|---|---|
| Who can create? | Data source editors | Report editors |
| Works on blended data? | No | Yes |
| Include other calculated fields? | Yes | No |
| Where can the field be used? | Any report based on the data source | Only the specific chart in which it was created |
Data type
The data type of a calculated field depends on the functions involved in the formula:
- Formulas that use arithmetic or aggregation functions, such as
SUM,COUNT, orMAX, create Number type fields. - Formulas that use text functions, such as
CONCAT,SUBSTR, orLOWER, create Text type fields. - Formulas that use date and time functions create Number or Date & Time types fields, depending on the function used.
You can change the data type of your calculated fields using the Type drop-down menu in the data source editor.
Learn more about data types.
Aggregation and calculated fields
Aggregation is the method by which a field's data is summarized. You can construct calculated fields that work on unaggregated, row-by-row values, or on aggregated values.
For example, suppose you have 2 unaggregated numeric dimensions, Price and Quantity Sold, with the following data:
| Order Date | Item | Quantity Sold | Price |
| 10/2/2019 | Pretty Bird Bird Seed |
7 |
7.99 |
| 10/3/2019 | Pretty Bird Bird Seed |
5 |
7.99 |
| 10/8/2019 | Pretty Bird Bird Seed |
3 |
7.99 |
| 10/13/2019 | Pretty Bird Bird Seed |
5 |
7.99 |
To calculate the total value for these orders, you'd multiply Price and Quantity Sold:
Price * Quantity Sold
If you create this field in the data source, the result is an unaggregated numeric dimension. Using this in a chart uses the default aggregation of Sum and calculates the total per row of your data.
To create an aggregated calculated metric, include the desired aggregation functions for any of the numeric fields that make up the formula. For example, suppose you want to display your total profit margin in a scorecard. You could do so with a formula like this:
SUM(Profit) / SUM(Revenue)
When you explicitly specify the aggregation method, the field's default aggregation is set to Auto.This ensures that Looker Studio aggregates the formula as intended and prevents your calculated fields from being broken if someone changes the default aggregation.
What you can do with calculated fields
Calculated fields let you perform these tasks:
- Do basic math with numeric fields
- Manipulate your data with functions
- Use branching logic
- Create custom groups
Do basic math with numeric fields
You can do simple arithmetic calculations using the normal operators:
- Addition: +
- Subtraction: -
- Division: /
- Multiplication: *
You can construct a calculated field using any of the operators above in combination with static numeric values and unaggregated numeric fields from your data source. Use parentheses to force calculation order.
Examples
Users / New Users
(SUM(Price) * SUM(Quantity)) * .085
Learn more about operators.
Manipulate your data with functions
Functions let you aggregate your data in different ways, apply mathematical and statistical operations, manipulate text, and work with date and geographic information.
Examples
SUM(Quantity) - adds the values in the Quantity field.
PERCENTILE(Users per day, 50) -- returns the 50th percentile of all values of the Users per day field.
ROUND(Revenue Per User, 0) -- rounds the Revenue per User field to 0 places.
SUBSTR(Campaign, 1, 5) -- returns the first 5 characters of the Campaign field.
REGEXP_EXTRACT(Pipe delimited values, R'^([a-zA-Z_]*)(\|)') -- extracts the first value in a pipe delimited string.
DATETIME_DIFF(Start Date, End Date) -- calculates the number of days between Start Date and End Date.
PARSE_DATETIME("%d/%m/%Y %H:%M:%S", DateTimeText)- create a date from a text field.
TOCITY(Criteria ID, "CRITERIA_ID") -- Display the associated city name from a valid Google Ads Geographical Targeting criteria ID.
Learn more about using functions.
Use branching logic
CASE statements let you perform branching "if/then/else" style logic in your calculated fields. For example, the following CASE formula categorizes the specified countries into regions, while grouping unspecified ones into an "Other" category:
CASE
    WHEN Country IN ("USA","Canada","Mexico") THEN "North America"
    WHEN Country IN ("England","France") THEN "Europe"
    ELSE "Other"
END
Create a custom group
Custom groups let you create ad hoc custom groups for dimensions without needing to develop or code CASE logic in calculated fields or SQL. This can be helpful when you want to assign fixed labels or category names to values that match specific conditions.
For example, a table chart called FAA flight count by destination displays a Record Count metric that is grouped by a DestState dimension that represents flight destinations.
The report creator wants to view and compare the data by region instead of by individual states, but there is no Region dimension available in the data source. The report creator can group specific states or countries into regions by creating a custom group.
The report creator adds a custom group calculated field to the chart by entering the following specifications:
- In the Selected field to group by field, the report creator selects the DestState field.
- In the New field name field, the report creator provides a name for the new group field. It is called Flight destination region.
- In the Group name field, the report creator inputs Pacific Northwest to represent the states that are grouped in the Pacific Northwest region.
- In the Include or Exclude drop down menu, the report creator selects Include.
-
In the Condition drop down menu, the report creator selects the
Infunction so that they can specify specific values for the Pacific Northwest group. -
In the Group values field, the report creator inputs the state abbreviations OR, WY, ID, MT, and WA.
-
The report creator wants to see how the Pacific Northwest region compares to the rest of the country. The report creator checks the Group remaining values as a new group checkbox.
-
In the Group name for remaining values field, the report creator inputs the label Other US regions, so that all remaining states that are not in the Pacific Northwest group are grouped together under one label.
-
The report editor clicks Save.
The resulting table now displays the Record Count metric grouped by the new Flight destination region dimension groups: Pacific Northwest and Other US regions.
This lets users quickly understand how many flight destinations were located in the Pacific Northwest region (4,430,314 flights), compared to other US regions (112,334,509 flights).
Learn more about custom groups.
Related resources
- Looker Studio function list
- Dimensions and metrics
- Format fields in reports
- Create a data source
- Create a custom group