A cohort is a group of users who share a common characteristic that is identified in this report by an Analytics dimension. For example, all users with the same Acquisition Date belong to the same cohort. Cohort exploration allows you to explore the behavior of these groups over time on your app or site.

Create a cohort exploration
- Sign in to Google Analytics.
- On the left, click
Explore.
- At the top of the screen, click Template Gallery, then select the Cohort exploration template.
- Define the Inclusion criterion: the condition that adds a user to a cohort.
- Set the Return criterion: a subsequent condition these users meet to remain in your cohort.
- Monitor how your users' behavior changes over time by looking at cohorts from different dates.
For example you can see how long it takes newly acquired users to transact on your site and how that changes in the week you are running a promotion, or how many users you retain over time and if that new app design you just launched is improving retention rates.
How cohort exploration works
Cohort exploration starts by finding the users who satisfy the selected inclusion and return criteria. You can create cohorts based on your user's acquisition date, an event they triggered, their transactions, or their conversions.
Cohort analyses group cohorts into daily, weekly, or monthly granularity. The data table shows how many users belong to each cohort for the duration of the exploration.
Each cell in the data table shows the number of users who met the return criterion after the start date. For example, if you select daily granularity and look at the cohort for January 1st, the day 1 column represents the subset of users who met the inclusion criterion on January 1st and also the return criterion on January 2nd.
Users are assigned to all cohorts for which they meet the inclusion criterion. For example, if you select transactions as the inclusion criterion, a user who completes a transaction in every week of the exploration timeframe is assigned to each row (cohort) in the table.
Configure the cohort exploration
Cohort inclusion
Defines the initial condition a user has to meet to be included in a cohort.
- First touch (acquisition date): the first time the user visited your app or website, as measured by this Google Analytics property.
- Any event: the first event for the user within the exploration date range.
- Any transaction: the first time the user had a transaction event within the exploration date range.
- Any conversion: the first time the user had a conversion event within the exploration date range.
- Others: a specific event triggered by the user.
Return criteria
Defines the returning condition a user must meet to be included in a cohort.
- Any event: the user has at least 1 event within the exploration time period.
- Any transaction: the user has at least 1 transaction event within the exploration time period,
- Any conversion: the user has at least 1 conversion event within the exploration time period.
- Others: a specific event triggered by the user within the exploration time period.
- For Cohort inclusion, under Others, choose a custom error event you've defined.
- For Return criteria, under Others, choose the app_remove event.
Cohort granularity
Defines the initial and returning cohort time frame. The return time granularity is the same as the cohort granularity. Select from:
- Daily: from midnight to midnight in the property timezone.
- Weekly: from Sunday to Saturday included, not on a rolling 7 days.
- Monthly: from the beginning of the month to the end of the month.
Cohort calculation
Determines how user activity across the exploration period contributes to the metric calculation in each cell of the exploration. The 3 calculation types are:
Standard
Each cell includes all cohort users who meet the return criteria for that individual period, regardless of what they do in other periods. The metric displays the total value for that individual period.
Rolling
Each cell includes all cohort users who meet the return criteria for that period as well as all previous periods. The metric displays the total value for that individual period.
Cumulative
Each cell includes all cohort users who meet the return criteria in any period in the exploration. The metric displays the cumulative total value for each period.
Breakdown
Divides each cohort into sub-groups based on a selected dimension so you can easily compare how a cohort differs along that dimension.
Values
Determines the metric to show in the cohort table. For example, Active users shows how many active users meet the criterion for being included in each cell of the table.
Understand the cohort exploration
Example 1
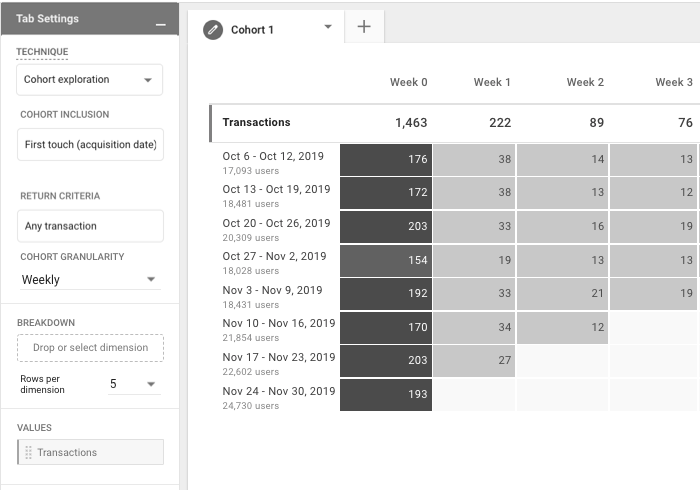
Between October 6th and October 12th, this site acquired 17,093 users.
These 17,093 newly acquired users had 176 transactions in the same week they were acquired (Oct 6th to Oct 12th).
These same 17,093 users had 38 transactions the week following their acquisition week (Oct 13th to Oct 19th).
Example 2

Between October 6th and October 12th this site acquired 17,093 users.
Of the 17,093 newly acquired users in the week from Oct 6th to Oct 12th, 171 had at least one transaction in the same week they were acquired (Oct 6th to Oct 12th).
Of the 17,093 newly acquired users in the week from Oct 6th to Oct 12th, 31 had at least one transaction in the first week after they were acquired (Oct 13th to Oct 19th).
Example 3

Between October 6th and October 12th, this site had 270 users with at least one transaction.
Of the 270 users who had at least one transaction during this time, 14 had at least one transaction in the following week (Oct 13th to Oct 19th).
Example 4
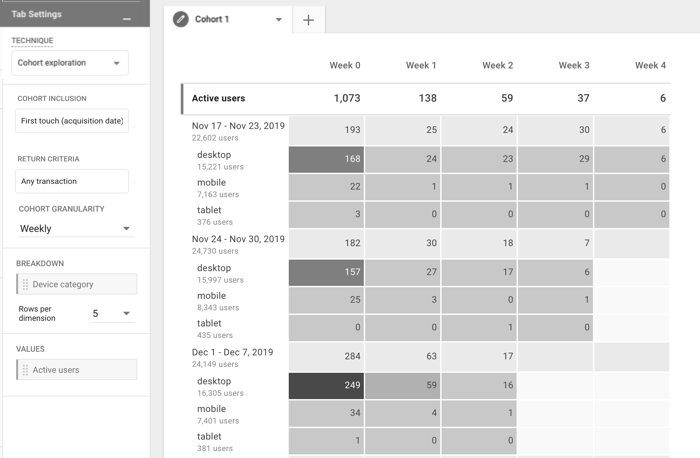
This example shows the results of adding Device category as the breakdown dimension. Each cohort is broken down according to which device type the user was using when they were acquired (desktop, mobile, or tablet).
When you include a breakdown dimension, users are only attributed to the first instance of the breakdown value that applies to them. For example, say User A first appears as a mobile user, then returns the same day as a desktop user. User A only appears in the mobile breakdown for that cohort.
Limits of cohort exploration
- Cohort exploration can show a maximum of 60 cohorts.
- When you apply a breakdown dimension, a maximum of the top 15 values of that dimension are shown.
- Demographic dimensions are subject to thresholding. If the number of users in the cohort is too small to protect their anonymity, those users won't be included in the exploration.