The Retention overview report is a pre-made overview report that summarizes how well your website or app retains users, including the average amount of time users spend engaged on your site or app after they were first acquired and the percentage of users who return each day in their first 42 days.
The report appears on the left in the Life cycle collection. You won't see the report in the Business objectives collection by default, but an editor or administrator can add the report to your left navigation.
View the report
- From the left menu, select Reports
.
- On the left, click Retention in the Life cycle collection.
Pre-made summary cards
The Retention overview report includes the following summary cards by default. Administrators and editors can change the cards so you may see different ones from these.
New users and Returning users

New users shows the number of users who visited your website or app for the first time. The value in the tab shows the total number of new users in the specified time period, while the individual data points show the number of new users for that day.
Returning users shows the number of users who have visited your website or app at least once before. The value in the tab shows the total number of returning users in the specified time period, while the individual data points show the number of returning users for that day.
User retention by cohort

User retention by cohort shows how well your site or app retains users by cohort. A cohort is a collection of users who are grouped by some criteria. In this case, the cohort is the day the user was acquired.
The chart includes up to three lines, one for each cohort. The "Day 1", "Day 7" and "Day 30" lines show the average amount of time spent on your site or app after 1, 7, and 30 days since they were first acquired.
For example, 4 users visit your site on October 1. By October 2, 3 users return so the "Day 1" line on October 1 will be 75%. By October 8, 2 users return so the "Day 7" line on October 1 will be 50%. By October 31, 1 user returns so the "Day 30" line on October 1 will be 25%.
The previous chart shows that by August 30, 5.8% of users returned to the website, and by September 5, 0% of users returned to the website. The data in this chart suggests that the website or app isn't retaining users successfully.
User engagement by cohort
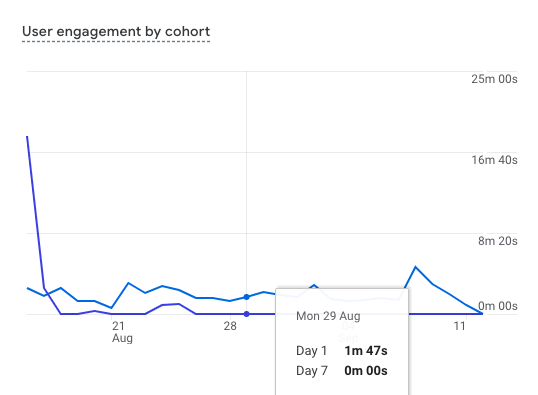
User engagement by cohort shows the average amount of time users spend engaged on your site or app after they were first acquired. In this case, the cohort is the day that the user was acquired.
The chart includes up to three lines, one for each cohort. The "Day 1", "Day 7" and "Day 30" lines show the average amount of time spent on your site or app after 1, 7, and 30 days since they were first acquired.
For example, the previous chart shows that by August 29, users spent an average of 1 minute and 47 seconds on the website. It also shows that by September 5, users average 0 minutes and 00 seconds on the website. The data in this graph suggests that the website isn't retaining users successfully. If users found the website more useful over time, you would see an increase in engagement 7 days later.
User retention

User retention shows the percentage of users who return each day in their first 42 days. The chart starts with 100% user retention when all users visit for the first time. It decreases from the first day as users drop off.
User engagement

User engagement shows the average engagement time of users who return in their first 42 days. Only returning users are included in the average engagement time.
Lifetime value

Lifetime value shows the average revenue generated by new users over their first 120 days. The chart can help you determine how valuable users are based on the additional revenue you generate. For example, a user purchases a shirt and then purchases pants the following week. Lifetime value (LTV) includes both purchases, indicating the overall success of the acquisition.