While AMP pages offer significant speed improvements over non-AMP mobile pages, accurate testing is important as you continue to invest in the pages.
When you publish AMP pages that appear in organic search, it is important to keep in mind that most of your mobile traffic will flow to the AMP version of the page This means the non-AMP version of the page will begin to receive very little organic search traffic on mobile.
There are two approaches to compare AMP and non-AMP page performance:
- Similar pages comparison, where you compare metrics for users going to AMP and non-AMP versions of similar pages.
- Time-based comparison, where you compare a page’s performance before and after launching AMP and using a control group to account for seasonality.
For this tutorial, we will demonstrate how to set up a comparison of similar pages to evaluate the differences in performance between your AMP and non-AMP pages.
Step 1: Configure Google Analytics on your AMP pages
Follow these guides to configure your AMP content to use Google Analytics:
Step 2: Identify groups
The next step is a thought exercise to define what content we are going to compare in the final report. For a given pagetype (ex: article, category or product detail page), identify two groups of pages with similar metrics for visits, bounce rate, and conversions:
- AMP Experiment Group: The ‘AMP Experiment’ group of URLs has the AMP URLs that have launched and are discoverable via Google Search.
- Non-AMP Control Group: The ‘Non-AMP Control’ group contains URLs that don't have any AMP equivalent. These URLs should perform similarly to URLs that do have an AMP version.
You will use these groups to monitor how AMP pages perform in comparison to non-AMP pages from the organic search channel.
Step 3: Create a custom report
The goal for this exercise will be to build a Google Analytics report that will compare two sets of similar pages from a sporting goods store. This website has AMP pages deployed for baseball products, and has not yet deployed AMP pages for basketball products.
To set up the custom report:
- In Google Analytics, go to Customization > Custom Reports.
- Click +New Custom Report.
- Create a custom report with the following settings:
- Title: AMP vs Non-AMP performance
- Name: AMP vs Non-AMP performance
- Type: Explorer
- Metric Groups: Add the following metrics:
- Pageviews
- Sessions
- % New Sessions
- Bounce Rate
- (Optional) Goal Completions: This depends on your customized Goal value. e.g. you may customize a Goal named “Total Lead Conversion”. Learn more about Goals.
- (Optional): Other metrics that you’d like to monitor, e.g.:
- Avg. session duration
- Pages / session
- Avg. order value
- Dimension Drilldowns: add Month of Year.
- Add Filters so that this report can focus on mobile traffic only:
- Click +Add Filter. Create a filter with these settings: Include > Device Category > Exact > "mobile".
- Click +Add Filter. Create a filter with these settings: Include > Source / Medium > Exact > "google / organic".
- Click Save. You should now see the basic report. This report can be retrieved in Google Analytics at any time from Customization > Custom Reports.
Step 4. Add the AMP experiment segment
In this step, you will add two segments – ‘AMP Experiment’ and ‘Non-AMP Control’ – to your comparison report.
- To open your new report from anywhere in Google Analytics, click Customization > Custom Reports > AMP vs Non-AMP performance.
- Click +Add Segment.
- Click +New Segment.
- Add the ‘AMP Experiment’ Segment. Assume that you have launched AMP Pages with URL pattern .../amp/products/baseball/...:
- In Conditions, add a filter for Sessions and Include.
- Add a condition with the settings: Landing Page > contains > /amp/products/baseball.
- Click Save.
Step 5: Add the Non-AMP control segment
For this step, you will add a control segment to the custom report that shows the performance of the site's basketball products. These pages all have URLs that contain "/products/basketball/".
- In the “Conditions” section that you accessed in the previous step, add a filter for “Sessions” and “Include”.
- Set the condition to: Landing Page > contains > “/products/basketball”
- Click Save.
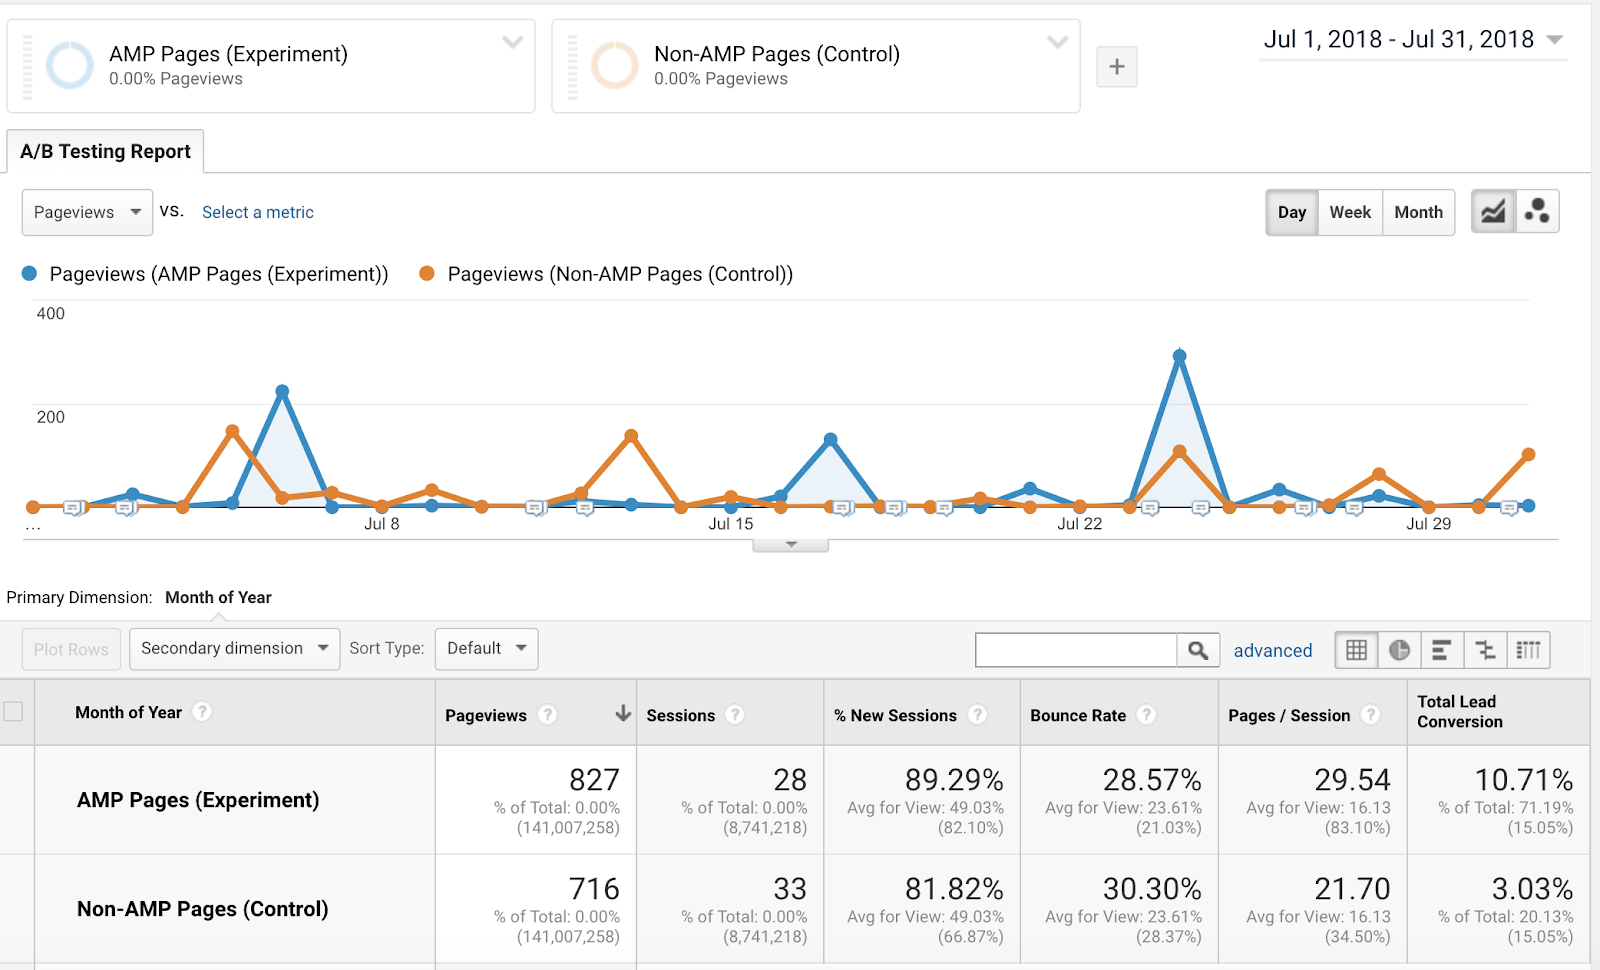
Final Custom Report
Your final report should look something like the screenshot below. Notice that there are graphs for AMP pageviews as compared to non-AMP pageviews, and you have useful metrics including bounce rates and conversions shown:
Considerations for AMP reports
There are often fundamental differences in Users with a native app installed might be taken to the native app instead of the website when they click through from the AMP viewer to the regular web property. This might artificially increase bounce rates and decreasing conversion and engagement measurements. If your app has a high enough market penetration to significantly skew AMP test results, try to exclude these users from a test by adapting the deep links the app can handle results between AMP pages and their non-AMP equivalents. Take these issues into consideration when you analyze your AMP-based Analytics reports.
Feature parity
If you want to compare AMP and non-AMP page performance for the same content, it is crucial that AMP pages are at parity with their non-AMP equivalents. Both pages must have similar visual design, information hierarchy and user experience.
Feature parity gaps that would make results unreliable include things like a missing promotional banner, customer reviews, filtered and sorted lists or tables, and search auto-complete functionality. These differences cause differences in user behavior which impact critical metrics such as bounce and conversion rates. To help close the gaps, dynamic interactive content is now supported on AMP pages via AMP components.
Native app users
Users with a native app installed might be taken to the native app instead of the website when they click through from the AMP viewer to the regular web property. This might artificially increase bounce rates and decreasing conversion and engagement measurements. If your app has a high enough market penetration to significantly skew AMP test results, try to exclude these users from a test by adapting the deep links the app can handle.
Bounce rate comparisons
"Bounce rate" is a metric that is commonly used to compare AMP vs. non-AMP page performance. AMP pages often report higher bounce rates than their non-AMP page equivalents. Learn more.
Inconsistency in reported events
In Google Analytics, a bounce is calculated specifically as a session that triggers a single request to the Analytics server. For instance, a bounce is recorded when a user opens a single page on your site and then exits the session without triggering any other requests to the Analytics server.
In addition to page view events, a page can have other events that trigger from user interactions, such as clicks that filter or sort results, or clicks on menu elements. (See About Events.) By default, these events are considered "interaction" events, and interaction events can result in lower bounce rates even when user does not navigate to additional pages in the session. To correct this, use a non-interaction event parameter to indicate that an event should be ignored for bounce rate calculations.
Underreported page load abandonment
Users will often leave if a page takes too long to load. This condition is called page load abandonment. In slow non-AMP pages, Google Analytics’ code snippet is loaded asynchronously and might not be ready to record events when the user leaves the page. This condition often results in underreported non-AMP pageviews. AMP pages typically do not have this problem, since most of them are loaded near-instantly from the AMP cache.
If your non-AMP pages are significantly slower than AMP pages, make sure you use a combination of metrics including conversion rates and revenue together with bounce-rates to understand the correct impact of AMP.
Time-based comparisons
Time-based comparisons can have impact on the metrics GA report. If you perform time-based tests, make sure you choose a large enough time period to ensure you have enough sample size to draw conclusions from. Make sure the start-date of your period is after Google has indexed all your AMP pages.
Inaccuracies due to sampled sessions
For Google Analytics Standard, report metrics can use up to 500,000 sessions within a selected date range. Once the selected range has more than 500,000 sessions, Google Analytics will use sampled data to generate metrics.
Use Custom Dimensions to distinguish AMP and non-AMP sessions
If you are unable to use "Landing Page contains" to identify AMP sessions (i.e. due to URL pattern limitations), you can instead use a custom dimension to differentiate between AMP and non-AMP sessions.
To send a custom dimension to Google Analytics, first update the config for your property to set the custom_map parameter for the dimension. Replace GA_MEASUREMENT_ID with your own Analytics ID.
// Maps 'dimension1' to 'is_AMP'.
gtag('config', 'GA_MEASUREMENT_ID', {
'custom_map': {'dimension1': 'is_AMP'}
});
Then use the custom parameter to send the value of the custom dimension i.e. Pass through "AMP" into the new custom dimension and have it trigger on every AMP page view.
// Sends an event that passes 'is_AMP' as a parameter.
gtag('event', 'is_AMP_dimension', {'is_AMP': AMP});
The above snippet will send the custom dimension dimension1 with the value of AMP to Google Analytics.
