The report is visible only in User-ID enabled views in those properties.
The Device Overlap report shows you how many different types of devices users engage your content with, so you can see the proportion of your user base that have one or several different kinds of devices.
With this report, you can group users by the different device types they have, and then compare the engagement and conversion rates of each group. For example, you might find that the segment of users that only use Mobile convert less often than the users that use both Mobile and Desktop.
Using the Device Overlap report
This report uses a Venn diagram to visualize data, so you can quickly get an idea of what proportion of users with a User ID assigned use only one type of device and what proportion use a combination of different device types. The visualization is designed to give you an overview of the data; it can’t display more than three device categories at a time. To get a deeper analysis, use the data table. It might also be easier to use the table when trying to analyze a small overlapping section in the diagram or when looking for exact numbers.
By default, the Desktop, Mobile, and Tablet are the device categories that appear in the diagram. Change which categories appear in the diagram using the checkboxes in the key. Learn more about the limits of User ID views, including how device categories are defined.
The data table displays all device types. A sum and average of the data appears in scorecards in the top row for each column, so you can quickly see the totals for Unique Users, Revenue, and User Transaction Rate. You can add and remove data to the Venn diagram using the radio buttons associated with each row.
This report supports both default and custom Segments. Each Segment appears as a separate Venn diagram and as an independent row in the data table. You can compare up to four segments at the same time.
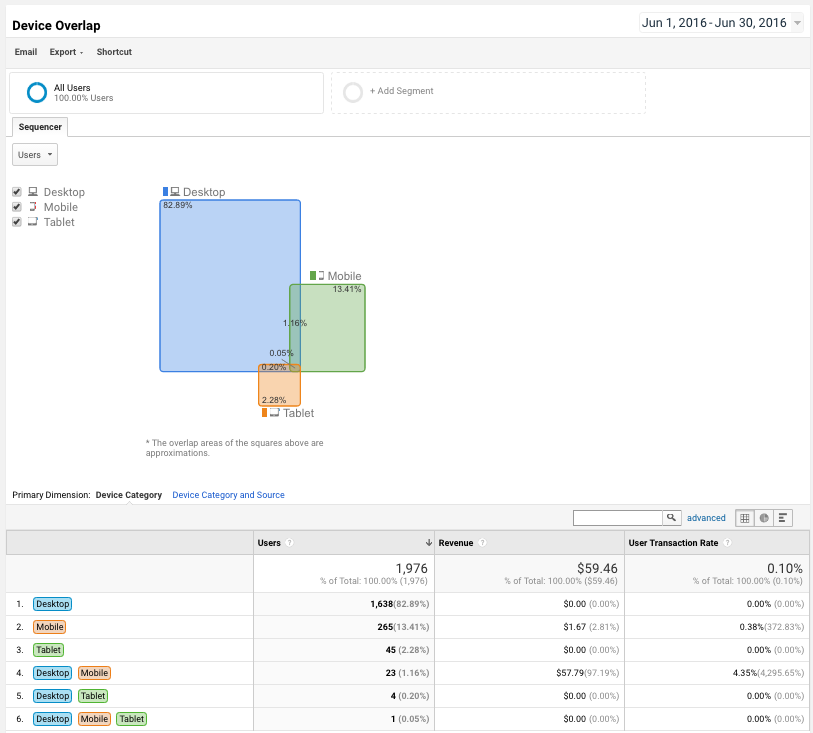
Click to expand this image and see where these options appear in the interface.
