The report is visible only in User-ID enabled views in those properties.
The Acquisition Device report combines attribution and traffic metrics so you can see the relationship between acquisition and conversion.
With this report, you can find out how many users you acquired on one type of device convert on that same type of device, how many convert on a different type of device, and how many don’t convert at all. For example, you might find that one segment of users make their first session and and purchases something in a subsequent session on a Tablet, while another segment make their first session on Mobile but generate more revenue on Desktop.
The Acquisition Device report can help you better understand how different devices contribute to the ways you attract new users and convince all users to convert.
Using the Acquisition Device report
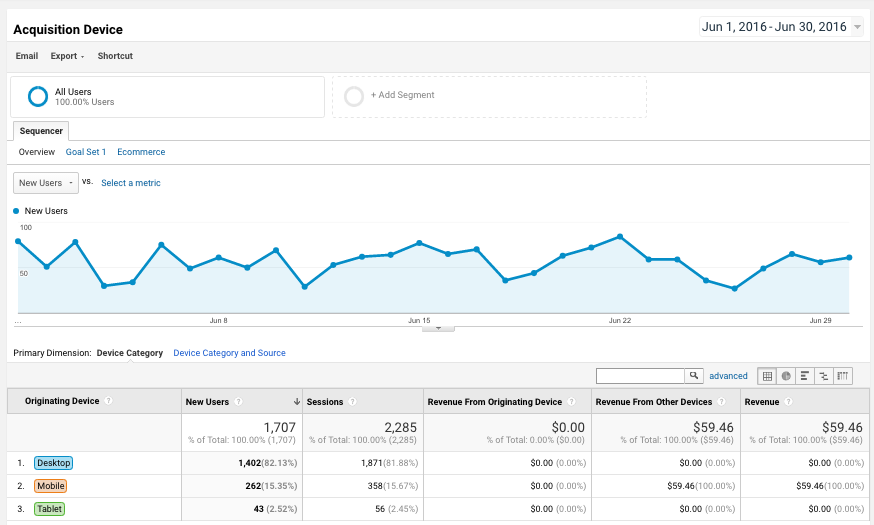
The data table in this report displays a row for each of the device categories defined in Analytics: Desktop (which includes laptops), Tablet, and Mobile.
The number of Users associated with each row represents the acquisitions that can be attributed to that device category. This is the segment of users that used a device in that category the first time they were assigned a User ID during the date range selected in the report. For example, Users in the Mobile row of the data table were assigned a User ID while using a mobile device, but they might have used another device (like a Tablet or Desktop) to engage with content or make a purchase both before and after their mobile session.
The Revenue for Originating Device metric shows you how much revenue was generated on the same device type on which you acquired those users.
Revenue From Other Devices displays how much revenue is generated on devices in a different category than the one on which you acquired those users.
Totals for these metrics, which combine data from all three device categories, appear as scorecards above the data table; details for each category only appear in the data table.
Revenue in a User ID view is calculated based on user and not session data, the numbers are different than in other reports. Learn more about limits of User ID views.
Click to expand this image and see where these options appear in the interface.