Although you might see a special feature in a specific flow report, this article describes the controls that are standard in all flow reports.
In this article:Select a starting dimension
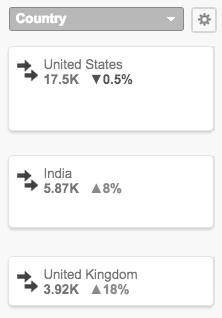
Dimensions provide a starting point for the data you see in a report. For example, if you select Country as a dimension, country names appear as dimension values in the nodes in the left column, indicating traffic represented in the report is linked to those locations.

To customize the values of the dimensions you see, click the gear icon next to the dimension menu to open the Customize dimension Items control.
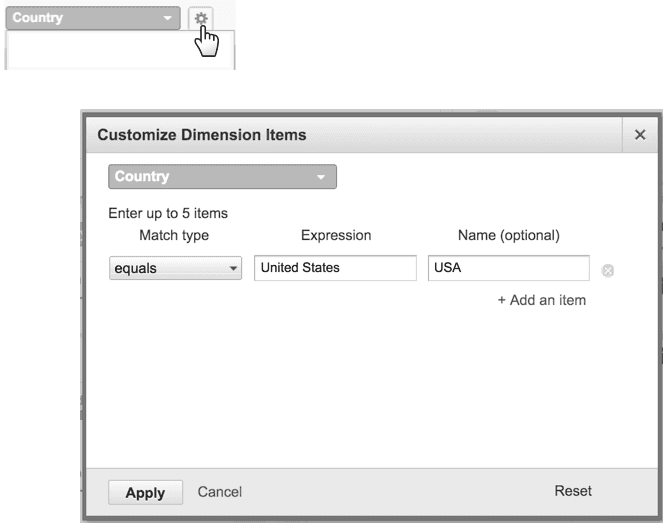
Enter up to 5 regular expressions to customize the dimensions. For example, if you are using the Country/Territory dimension and want to match United States, enter the following then click Apply:
- Match type: Equals
- Expression: United States
- Name: United States.
Apply Segments
Segments are like dynamic filters that allow you to dissect traffic quickly. Default Segments, like New Users and Direct Traffic, are standard in all Analytics accounts. Use Segments to filter for specific traffic, like users who have made a purchase, or spend more than a certain amount of time on your site.
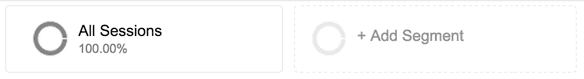
Flow reports support only session-based segments. User-based segments are disabled for flow reports. You can apply only a single segment to a flow report.
Pan and zoom
Use the arrows to pan right and left. You can also grab and drag the screen with your mouse to pan. Use the + and - slider to zoom (make the nodes and connections smaller or larger). Click the home icon to return to the starting view.

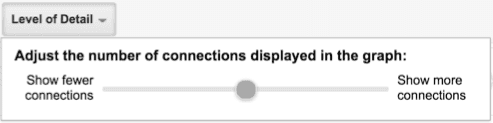
Adjust the level of connection detail
Select Level of Detail and use the slider to adjust the connections displayed . The slider doesn’t affect the actual number of connections; it’s just a way for you to view fewer or more connections in a report.
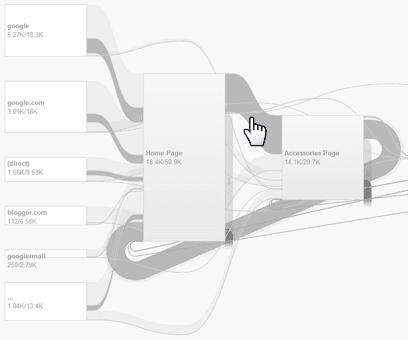
Examine nodes and connections
Hover over a node to see things like*:
- The number of pages or events represented by a node
- How many users moved on to another page or event
- How many users exited your site from that node
- The total number of sessions or step completions for the node

Hover over a connection to see things like*:
- The total number of sessions that passed through that connection
- The number of step completions for that connection
- The percentage of traffic represented by that connection
- How many users moved on to another page or event

* The actual display depends on the type of flow visualization.
Hover over a node exit to see the breakdown of how users exited that node.

Focus on one traffic segment
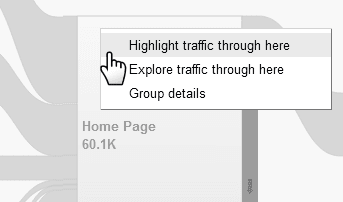
Click a node to select one of the following options:
- Highlight traffic through here: Highlights the all the connections through the entire flow made by that traffic segment. To remove the highlight, click the node again, then click Clear highlighting.
- View only this segment (dimension nodes only): Only displays the traffic from that dimension/segment. Use your browser's Back button or the breadcrumb to go back.
- Explore traffic through here: Shows all connections to and from the node. In this mode, you can add additional steps in the paths before and after the node. Use the browser's button or the breadcrumb to go back.
- Group details: Displays the components, like individual pages or events, that are grouped together in that node. Use this option to see details such as:
- Top Segments (dimension nodes only): The current metric
- Outgoing Traffic (dimension nodes only): The pages to which traffic flowed from that node
- Top Pages: The pages that traffic goes to most often. For example, if a node represents a collection of pages in the Wearables directory, then you see information about the pages in that directory that had the most traffic.
- Traffic Breakdown: Not available with Goal Flow
- Incoming Traffic: The pages that sent traffic to the node
- Outgoing Traffic: The pages to which the node sent traffic
- Funnel Entrances: The pages on your site from which users entered the funnel
- Funnel Exits: The pages in your funnel from which users exited
You can also click a connection to highlight just that traffic segment through the flow.
Change the date and use date comparison
By default, the flow reports displays data from the past 30 days but you can change the date with the calendar dropdown. To compare data from two date ranges, select Compare to Past and choose a second date range. Choose similar time periods — like full months or weeks that both start on a Sunday — for a fair comparison.
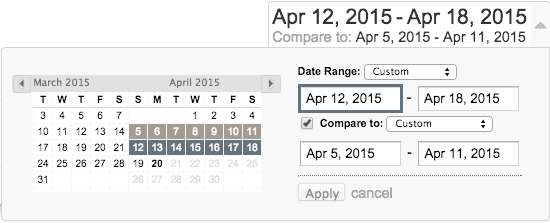
When you compare 2 date ranges, you can see the change in the degree and direction of traffic volume through each node between those periods. When you highlight a node or connection in a flow, the percentages on each node change to indicate differences just within that traffic stream. You can also hover over a node for details on how data compares between the two dates.
Export a report
Export any flow report as a PDF from the menu by clicking Export > PDF. What you see on your screen, including path highlights, appears in your document. For more information on exporting reports, read Email and Export Reports.
