This article explains how to use the Goal Flow report to make sure your site is performing optimally by answering 4 key questions. Before proceeding, you might want to review the content in the Related resources section below.
In this article:Is a Medium not performing as expected?
Set your starting dimension to Medium:
Say, for example, that you have recently started running a new email campaign, and want to see how effective it is at driving traffic and conversions. If you set up your visualization with Medium as the starting dimension and don’t see email as one of the nodes in the first column, you know immediately that something is wrong. Maybe you’re a little impatient and haven’t waited long enough for the data to be available in Analytics. Maybe the third-party who distributes your email has run into some difficulty. The copy could have been translated badly and isn’t having the desired impact on a foreign audience. Or it could be something simple like the link in the message is missing or pointing to the wrong URL.
On the other hand, you might discover that an email campaign is simply not an effective approach for the goal you have in mind, and you can stop allocating budget to sending email.
Is your site search working as expected?
Include your site search page as a funnel step:
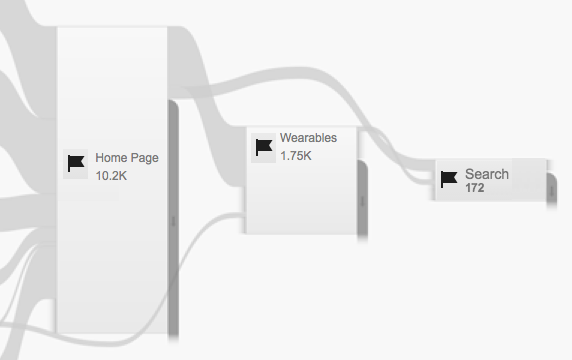
If you set up and configure site search in a web view, you can include your search URL in a goal funnel to see whether your site search is succeeding as expected. For example, you might expect users on a category page to search for specific items, so you can include the search URL after the category page in the funnel. If your site search is functioning as expected, you’ll likely see some traffic from the search node on to your goal page. On the other hand, if there’s a problem with your site search, then you might see very little or no traffic from the search node to your goal.
You can click the connections from the sources to see how traffic loops back from the search node and eventually drops off.
Is your website properly configured for different technologies?
Use the technology-related User dimensions to see how well your site performs on different browsers, operating systems, screen resolutions, etc.
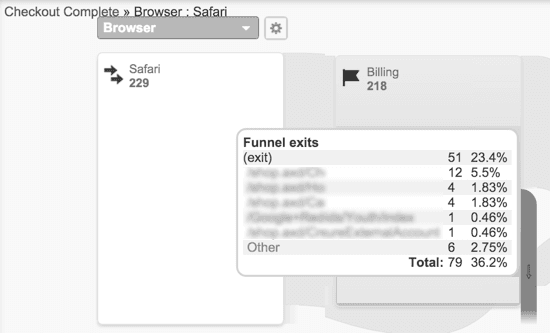
You can apply the same approach to these types of visualizations as we did to the previous ones. If you see significant dropoff for a particular browser, make sure your site is appearing as expected in that browser. If there’s significant dropoff when you get to a smaller screen resolution, check for things like Add to Cart buttons or links not being visible or easily clicked at those smaller sizes.
Do you need to translate your content?
Explore your goals through the Language dimension.

If you offer multiple language versions of your content, you can set up goals and funnels for each language, and use the language-specific pages or screens for the funnel steps. Then, in the Goal Flow report, use the Language dimension to see how your users are spread across the language spectrum, and whether you have the same relative levels of success with each language.
Click the Language dimension nodes in the first column and use the View only this segment or Highlight traffic through here options to see how the number of users in each language compares to the number of conversions. This can lead to actionable insights regarding your content.
For example, suppose you find that on your English language-only website the conversion rate for US-English-speaking traffic is 4.3%. Surprisingly, you also find that there’s a fair amount of traffic from Brazillian-Portuguese-speaking users, and that these users have an even higher conversion rate of 4.6%. It seems your site is even more popular with Brazillians, at least those who can navigate your site in English.
Given the rate at which these users convert, it might be in your best interest to offer a Brazillian Portuguese version of your content.
If you do offer different language versions, check the flows for the goal funnels in each language to be sure that your translations haven’t introduced any stumbling blocks for your users. For example, if you see an unusually high rate of drop-off for a single page, check whether the translation introduced an error in instructions, or didn’t effectively capture the spirit of the original content.
