You can easily see the origins of the traffic to your site that result in goal conversions. Just set up the visualization by Source, Campaign, Country, Browser, or any of the other available starting dimensions.
In this article:Compare traffic by the Source dimension
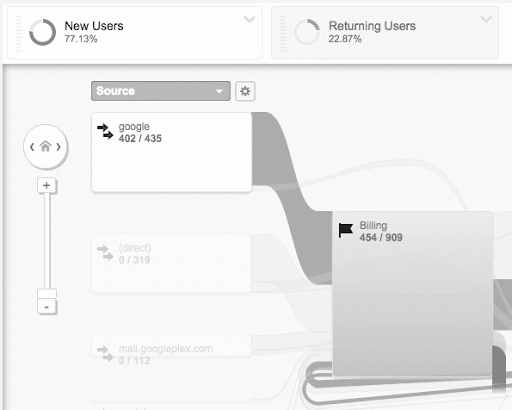
In the example below, the visualization is set up to use the Source dimension. In the first column of nodes, you can quickly see the relative amounts of traffic from the top five sources, including direct traffic.

In this example, the dimension value google (which includes organic search and cpc) sent the most traffic (769 sessions). To see whether it also delivered the most completions for a particular goal or funnel step, click the connection between the google node and the goal or step node (Billing, in the example above).

Traffic from that source through your goal path is highlighted. In addition, the goal or step nodes list the relative contribution of goal step completions. In this case, of the 769 total sessions originating from the google Source, 645 of them proceeded to the Billing step.
To compare those numbers to the ones from other sources, simply click the connection between that other source and the goal or step. You can also see the relative conversion rate per source in the last column of the data table at the bottom of the Goal Flow report.

Apply Segments
You can apply Segments to your Goal Flow visualization to examine your conversions in even more refined ways. You can define multiple Segments for the report, however, you can only apply a single Segment at a time.
Use Advanced Segments with multiple filters to work around the single Segment limitation.
Next steps
You can make similar comparisons by any of the other dimensions, and allocate resources accordingly.
For example, if you use Campaign as the dimension, you can see which campaigns are delivering the best results, and which ones you can either improve or retire. If you use Country, you can see the geographic origins of your traffic, and decide where it is most prudent to invest your advertising dollars.