Google Surveys aggregates and analyzes responses from users and presents the results in a simple online interface. You can view these results online or export them to a spreadsheet.
In this article:- View results
- Export results
- How long before I start to see results?
- Why do I see more responses than I paid for?
- What happens if users don't answer all of my questions or they screen out?
- Why are there more responses on the survey-results-overview page but fewer in the question-results page?
- What data is included in my export?
- How do I use the weights column to calculate weighted results?
- Can I do cross-tab analysis within the survey results page?
View results
To view your survey results:
- Sign in to Google Surveys.
- Click the survey you want to view on the survey dashboard.
- Click the text of any question to see individual question results. Keep in mind that the responses reported for each question include all users who answered that question, even if they did not complete the survey.
- Click the inferred-demographic segments in the left-hand pane to segment the data by inferred age, gender, or geography.
Export results
To export your data:
- Sign in to Google Surveys.
- Click the survey whose data you want.
- On either the survey-results or question-results page, click Download
.
The Excel file is saved in your default download location.
Your survey starts collecting responses minutes after it goes live. You start seeing results in your online account once the data is processed, which usually happens in a matter of hours.
While we're in the process of collecting results, you may notice that the respondents do not match the demographic mix of your target population. However, as we collect more results, the demographic mix will more closely match the targeted population. While we encourage you to look at your results as they become available, you shouldn't draw any conclusions until the survey is complete and we've collected all results.
The system errs on the side of collecting too much rather than too little data, so at times you may see more responses than requested. However, you will only be charged for the number of completed responses you purchased.
You will not be charged for responses from users who only answer your screening question (without answering the follow-up question) or who drop out midway through your survey.
The total survey responses are the unweighted results, while the question results are the weighted results. To switch off weighting and show all responses, click a question in the survey overview, then turn on the Raw counts toggle at the top of the question-results page.
There is a discrepancy between the number of unweighted and weighted responses because of respondents with unknown demographics. Google Surveys uses post-stratification weighting to compensate for sample deficiencies and reduce bias. However, weighting can only be applied to respondents whose age, gender, and geography are known. Some responses have unknown demographic values, and thus are not shown when weighting is on.
Learn more about weighting.
Your exported file includes multiple tabs: Overview, Topline, Complete responses, All responses, and Crosstabs. These contain the following data:
- Overview: A general overview of your question text, answers, and counts of responses.
- Topline: A breakdown of answer proportions for each of your survey questions. The data here includes all incomplete responses.
- All responses & Complete responses: Response-level data for users who answered any question or all questions in your survey, respectively. The columns are:
- User ID: A numeric ID for each user who answers the survey. Note that you cannot match users across different surveys: the same user will have different User IDs in the Excel downloads of different surveys.
- Time: Date and time in UTC, in the format 2017-11-16 17:22:39.
- Survey Completion: Defines whether a respondent completed all questions in a survey (Complete), screened out (Screen-out), or dropped off but didn't screen out (Partial). Learn more about response types.
- Publisher Category: The kind of publisher site on which the respondent saw the survey. The categories are News, Arts & Entertainment, Shopping, Reference, Mobile App, Other, and Website Satisfaction.
- Gender: Inferred gender: Male, Female, or Unknown.
- Age: Inferred age bucket: 18-24, 25-34, 35-44, 45-54, 55-64, 65+, or Unknown.
- Geography: Inferred location encoded as a string with the format [Country]-[Region]-[State]-[City]. For example, US-WEST-NM-Albuquerque. We include the most detailed breakdown available, and report Unknown if the country is unknown.
- Weight: The weighting applied to this response to match the CPS (Current Population Survey) demographics.
- Answer: The respondent’s answer to this question.
- Response Time: The amount of time in milliseconds it took the respondent to provide an answer to this question.
- Crosstabs: This tab provides a cross-tabulation analysis for users who answered all questions (i.e., complete responses) in your survey.
Learn more about weighting and the Surveys methodology.
Depending on which results you want, there are a few ways to calculate weighted results using the Weight column in the Excel file you export.
Complete responses
To calculate weighted results for complete responses to any question in the survey, start with the Complete responses tab. You can apply weights to the results by creating a pivot table where the columns are the answers to a question and the data is the sum of the weights. Note that some responses will be dropped when you look at weighted results because Surveys cannot calculate weights for responses with unknown demographics. If you look at the sum of the weights in the Complete responses tab, it's equal to the number of rows that have weights, which is usually different from the total number of rows.
All responses
To calculate weighted results for the responses to any question in the survey, start with the All responses tab.
First-question results
For the first question in the survey, you can use the Weight column directly. The method to do this is the same as described above for complete responses, but use the All responses tab instead of the Complete responses tab.
Other question results
If you want to calculate results for the last question, use the weights in the Complete responses tab as described above. If you want to calculate results for any question other than the first or last question, you need to filter the rows and renormalize the weights before applying them to get results.
Here's a renormalizing example:
- There are 100 rows with weights in the All Responses tab, so the sum of the weights column is 100. There are only 50 rows with weights and an answer to the second question because respondents screened out or dropped out of the survey after the first question.
- If you filter to only the rows that have weights and an answer to the second question, there's no guarantee that the remaining weights will add up to 50; let’s say they add up to 40 instead. You'll need to renormalize the weights column by multiplying each weight by 50 / 40 = 1.25. This will ensure that the sum of the renormalized weights is 50. You can now use these renormalized weights to calculate the results with a pivot table.
Filtered responses
If you want to calculate weighted results for a filtered set of responses, such as 65+ Females, then you need to renormalize those weights as well. First, filter the rows to only the rows you want to see; in this example, that's only 65+ Females. Then follow the same renormalizing procedure described above.
Use Cross-tab analysis to see how different groups of users answered your survey questions. You can export the data to a spreadsheet or you can do it online.
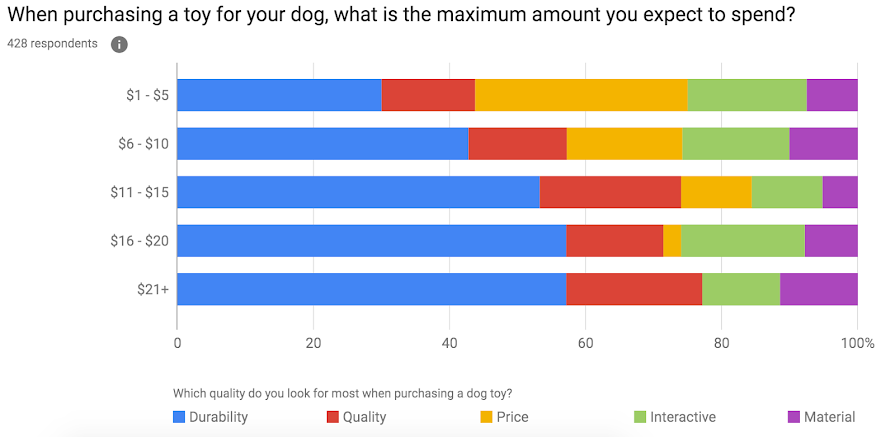
Let's say you're starting a dog toy company. You want to better understand the relationship between price and qualities people look for in the toys they buy for their dogs. You ask the following questions:
- Do you own a dog?
- Yes (target answer)
- No
- I prefer not to say
- Which quality do you look for most when purchasing a dog toy?
- Durability
- Quality
- Price
- Interactive
- Material
- When purchasing a toy for your dog, what is the maximum amount you expect to spend?
- $1 - $5
- $6 - $10
- $11 - $15
- $16 - $20
- $21+
To analyze how different users felt about price in comparison to quality, follow these instructions:
- Sign in to Google Surveys.
- Click the survey you want to view on the dashboard page.
- Click the text of any question in the overview to see individual question results.
- Under Comparisons click Another question.
- Select which question you want to compare.
- The results bars at the top give you a graphic representation comparing the two questions.
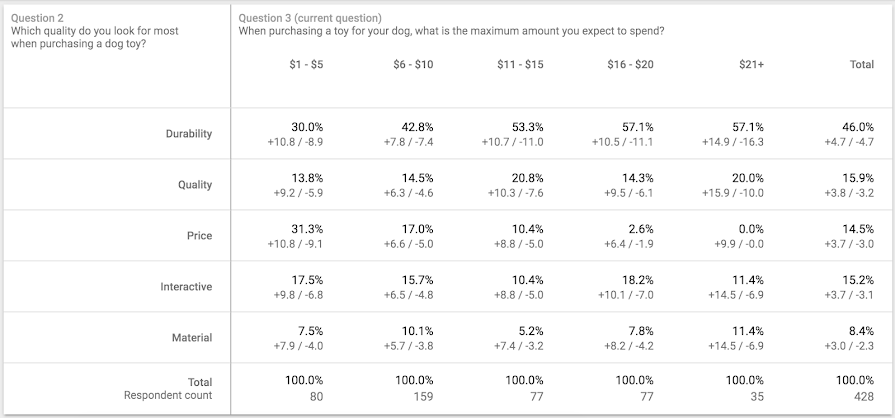
- The chart at the bottom compares the results of the two questions.
- You can also add layers, such as age or gender, to continue to analyze the data, or add demographic filters to restrict the data to answers from a specific population of users.
If your survey is targeted by zip code or with userlists, the smallest dimension must have at least five responses for filtering options to be enabled. If additional layers of filters (age, gender) allow a user to deduce personally identifiable information from the smallest dimension, those filters may be disabled.