At a glance
Have you seen this error message?
Unable to aggregate ratio metrics in the request. Please select another metric. This error means you've asked Looker Studio to do something with an already aggregated ratio metric that it can't do. For example, you've applied a filter based on a calculated field to a chart that contains a ratio metric.
The solution is to select a non-ratio field in the chart (e.g., use Impressions instead of CTR), or remove or change the filter.
In this article:In depth
Ratio metrics show the relative sizes of two or more values. For instance, the Google Ads metric , e.g. Clickthrough rate (CTR) is the number of clicks that your ad receives divided by the number of times your ad is shown. In Google Analytics, Bounce Rate is single-page sessions divided by all sessions, while Entrances / Pageviews calculates the ratio of visitors entering your site and beginning a new session compared to the number of pageviews.
In Looker Studio, you get the error above when you filter a chart that includes ratio metrics in a way that requires the product to recalculate the ratios.
Here are 3 things to help you understand this issue:
1) Data from data sets such as Google Analytics, Google Ads, YouTube, and Google Marketing Platforms products is already aggregated by the time it gets to Looker Studio. For example, when Looker Studio requests a Google Ads metric such as CTR (click-through rate), the data is already processed into the appropriate aggregation type.
2) Because of the above, calculated field functions are applied to your data post-aggregation. It's not possible (nor would it generally make sense) to go back into the raw data and look at every unique instance of that metric. For example, if you try to create a calculated field with the formula SUM(Impressions) in a Google Ads data source, you'll get the error:
Re-aggregating metrics is not supported.
That's because Impressions is already aggregated (and its aggregation type, Auto, can't be changed).
3) For consistency, all calculated field functions in Looker Studio are available for use with all data source types, even if the underlying system doesn't natively support that function. For example, you can use the CONCAT function to join multiple values in any data source, even if the underlying system doesn't have a CONCAT function of its own. Instead of "pushing down" the CONCAT function to the underlying system, Looker Studio requests the data and performs the concatenation itself.
Aggregation failure example
So what does all that have to do with the "Unable to aggregate ratio metrics" error? Let's go a little deeper with the CONCAT example to find out.
Suppose you create a calculated field called Campaign : Click Type in a Google Ads data source, using the following formula:
CONCAT(Campaign, " : ", Click Type)Looker Studio issues queries for Campaign and Click Type individually, and then performs the concatenation. The results are grouped, so there is no duplication of records.
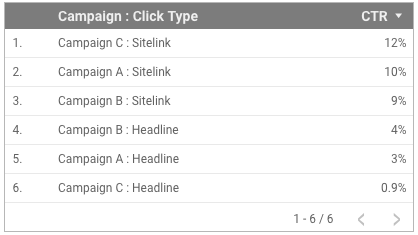
You can now use that concatenated field in your charts, and the metrics you include are aggregated properly. For example, we could use Campaign : Click Type as the dimension and CTR as the ratio metric in a table:
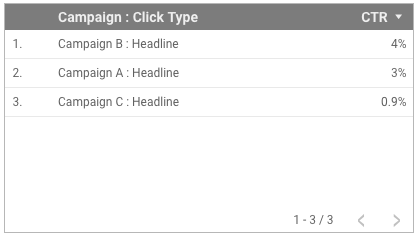
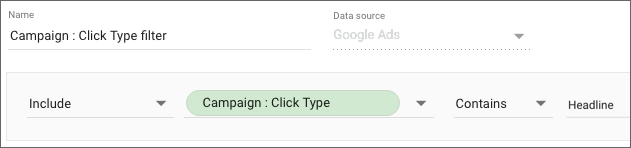
But now, let's say you apply a filter to show only those records where the Click Type is Headline:
This will break the chart:

Why it breaks
The filter asks Looker Studio to include each record returned by the Campaign : Click Type if it contains "Headline." That field is a concatenation of 2 dimensions: to fulfill this request, Looker Studio has to refetch those dimensions, and then apply the filter. The problem is the presence in the table of the ratio metric, CTR. Google Ads ratio metrics are computed before Looker Studio requests them. Looker Studio has no way to access the raw data and recompute the new ratios for the records that just contain "Headline" in the concatenated field.
The solution
The solution in cases like this depends on the data you are trying to show. In this example, you could either replace the CTR metric with a non-ratio metric, such as Impressions. Or, instead of filtering on the concatenated Campaign : Click Type field, put the filter on just the standard Click Type field, which would achieve the same result.

The chart now works: