If you experience an issue with a chart, report, or data source, check this guide to see if it's listed, and if so, click Steps to resolve to learn how you might further investigate and fix the problem.
In this article:Basic hygiene steps
Some issues with Looker Studio can be caused by temporary network errors or backend glitches. Try these basic hygiene steps before you spend a lot of time troubleshooting a problem. After you try each step, check to see if the issue is resolved.
Possible errors / symptoms
- Unresponsive pages
System errorLooker Studio is not available
Steps to resolve
- Refresh the browser window.
- Clear your browser cache and cookies.
- Restart your browser.
- Try using a different browser.
- Restart your computer.
- Try using a different computer, if possible.
If these steps don't solve the issue, wait a bit, and then check again. If the problem persists, you can see if other users are experiencing the same issue by searching on the Looker Studio Community forum.
Access issues
If you are a Google Workspace or Cloud Identity customer, your organization's administrator must enable Looker Studio before you can use it.
Possible errors / symptoms
We are sorry, but you do not have access to this service. Please contact your Organization Administrator for access.Steps to resolve
Connection issues
Data connection issues can occur for several reasons. Some issues are expected, such as when you don't have the proper credentials to view the data in a data source that's been shared with you. Other reasons include broken or incomplete configurations, deleted data sources, loss of authorization to the data, and so on.
Try these steps to resolve problems connecting to your data set.
Possible errors / symptoms
Missing data sourceData set configuration errorNo data set accessData source not attachedData source needs to be addedThe underlying data has changedDatabase connection error
Steps to resolve
- Edit the broken component and then add the correct data source.
- Refresh the data source fields
- Reconnect the data source.
- Remove the data source(s) from the reports, and then add them back.
- Create a new data source to see if that works.
- Revoke and then restore Looker Studio's access to your Google account.
Chart configuration issues
Charts with incomplete or incompatible chart configurations will display errors.
Possible errors / symptoms
System errorChart configuration incompleteInvalid combination of metrics and dimensions
Steps to resolve
- Fix or remove any invalid calculated fields.
- Choose different fields for the chart.
- Refresh the data source fields.
- Reconnect the data source.
About the "Invalid combination of metrics and dimensions" error
This error occurs when the chart tries to visualize data in a way that's not supported by the data source. This is a limitation of some backend systems, such as Google Analytics and Google Ads, where the data is stored in a fixed structure that only allows certain fields to be queried together.
User interface / functionality issues
If Looker Studio suddenly stops working or otherwise misbehaves, incompatible extensions or add-ons could be causing the problem.
Possible errors / symptoms
- Features not working
- Missing UI elements
- Product stops responding
Steps to resolve
- Try the basic hygiene steps above.
- Try a different browser.
- Disable browser extensions / add-ons.
If disabling all extensions solves the issue, try adding the extensions back in one at a time until you find out which one is causing the issue (then consider posting your discovery on the Looker Studio Community forum).
Blending issues
The most common issues people experience with blends can be put in the following buckets:
- Misconfigured joins
- Missing or incorrect data source connections
- Issues with / confusion over the blend results
Misconfigured join example errors / symptoms
One or more join configurations is incomplete.One or more join configurations is missing a join condition.Join key incomplete. Each selected data source must specify a join key field for every join key.- Pink "Missing" field in the join condition.
Steps to resolve
- Edit the join configuration.
- Make sure each configuration in the blend has a join condition and join operator (unless you're using a cross join, in which case no join condition is allowed).
- For missing fields: either remove the field, or make sure that each pair of join configurations has a corresponding field.
Missing or incorrect data source connection example errors / symptoms
One or more tables is missing its data source.Steps to resolve
Google Analytics 4 quotas exceeded
Beginning November 7, 2022, Looker Studio reports that connect to Google Analytics 4 data are subject to Google Analytics Data API (GA4) quotas. You can monitor your report's GA4 data usage via the Google Analytics Token Usage dialog.
View token usage
- Edit your Looker Studio report.
- To see your report's overall token usage, right-click the report canvas, then choose Google Analytics token usage.
- To see the token usage for a specific component, right-click the component, then choose Google Analytics token usage.
For the overall usage of Google Analytics 4 tokens, you can view:

- The number of quota tokens used by the entire report or per page for the current user session
- The number of quota tokens remain available before the quota is reached
- The number of quota tokens are consumed by each chart, sorted by those that use more tokens
For token usage by a specific component, you can view:
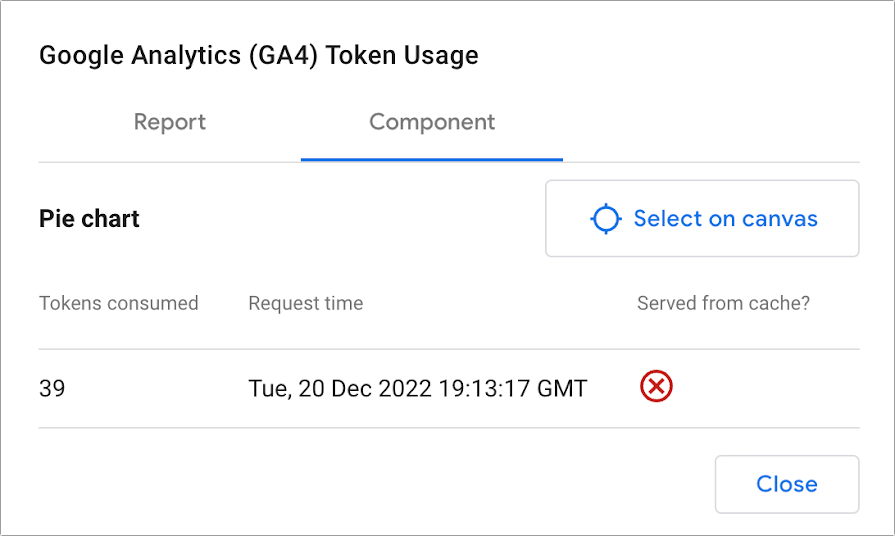
- The number of quota tokens have been consumed by each request
- The time that each request finished
- Whether or not the request was served from cache, where a red X indicates that the request was not served from cache and an encircled green checkmark indicates that the request was served from cache
Quota exceeded errors
Reports that exceed these quotas may display one of the following error messages:
Exhausted concurrent requests quota. Please send fewer requests concurrently.This property has issued too many requests in the last day.Too many requests using this Google Analytics property have encountered errors in the last hour.This property has issued too many requests in the last hour.This property is denied access to Google Analytics.This property has issued too many potentially thresholded requests in the last hour.This project/property has issued too many requests in the last hour.
Steps to resolve
If you experience this error, you have the following options to reduce the amount of data that is queried from Google Analytics 4. These steps can help avoid quota hits by increasing reliance on the Looker Studio data caching mechanism:
- First, use owner's credentials for the data source instead of viewer credentials to increase the likelihood of using cached data instead of querying data and using quota tokens. If you are relying on viewer's credentials, consider switching to owner's.
- If your reports use multiple Google Analytics 4 data sources, consider consolidating them if possible into a single reusable data source. This will also increase the likelihood of using cached data instead of querying data and using tokens.
- Reduce the traffic to the report. Consider sharing the report with fewer people, and don't embed the report in a high traffic website.
- Reduce the number of charts on each page.
- Extract the Google Analytics 4 data and use the extracted data instead of the Google Analytics 4 data source.
- Note: you'll need to wait until any exceeded quotas have refreshed before you can extract the data. Depending on the quota exceeded, this can take up to 24 hours.
- Export your Analytics data to BigQuery, then use the BigQuery connector to visualize that data in Looker Studio.
- Upgrade to Analytics 360.
- Consider using a partner connector.
Strategies for troubleshooting more complex issues
When you're trying to diagnose less obvious problems with Looker Studio, the first step is to identify where the problem is occurring.
For example, is the problem generalized, or is it restricted? Is it a problem with all your reports, or a specific report? Does it happen with every component type, or only with a specific component? Does the issue appear in multiple browsers or only in a specific version of a specific browser?
See also: What you need to use Looker Studio
The next step is to reduce the number of variables.
Generally, this means trying to isolate the problem to the fewest possible factors, by minimizing the data or simplifying the report. For example, if you suspect a problem with the data, try to use filters or edit the data set to reduce the number of rows by half. If the problem goes away but reappears when you include the other half of the rows, then you'll know the issue is somewhere in that second half of the data.
Similarly, if the problem is with a specific chart, first try creating a simple version of the chart with the minimum number of fields and simplest style options, and then gradually increase the complexity to see if the issue is caused by a specific field or setting.
Report a problem to Google
If you can't resolve the problem, you can report it to Google. To help us diagnose the problem, please be ready to provide the following information:
- A complete description of the problem.
- Steps to reproduce the problem.
- Any error messages or error IDs that appear.
- A link to a test report or data source that demonstrates the problem.
About error IDs
About test reports
As noted above, reducing the complexity of the test reports you share makes it easier for us to troubleshoot. If possible, the test report you create should be as simple as possible. For example, make a copy of the original report, then remove extra pages, charts, filters, and other components that aren't required to demonstrate the problem.