After you install the extension for your Chrome browser, you can load a page that you are tracking with Analytics and see the following information:
- Metrics: Pageviews, Unique Pageviews, Avg. Time on Page, Bounce Rate, % Exit
- Number of active visitors, in real time
- In-page click analysis (where users click on that page)
By default, the information appears in scorecards across the top of the page:

You need to have login access to the Analytics account collecting the information for the scorecard to appear.
In this article:Date range
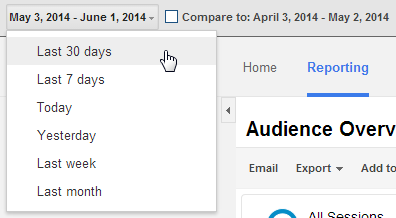
Use the date-range menu to select the time frame for the data you see in the extension. You can choose from a number of predefined date ranges. You can also choose to compare an equivalent date range.
Bubbles
For each clickable area on the page (e.g., links, buttons), you see a bubble that indicates the percentage of users who clicked there.

Click the bubble icon to turn the display of bubbles on or off.

Click the color icon to turn bubble colors on or off.
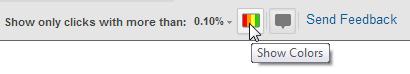
When the colors are on, bubbles are blue, green, orange, or red depending on the relative percentage of clicks.
Click threshold
Select the threshold for displaying bubbles with click data. Areas of the page whose clicks fall below the threshold do not have bubbles.

Segments
The Segment list includes all of the segments to which you have access. Select up to four segments to apply to the data in the extension. You see a separate set of scorecards for each segment.

Remove a segment by opening the list and clearing the selection for that segment.
Real-time only vs all data
Click the expand/collapse icons in the real-time control to show all metrics or only real-time data.

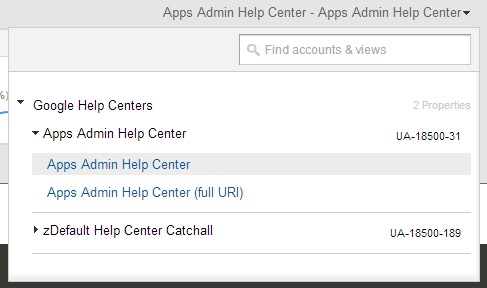
Account, Property, View
The Account/Property/View menu populates with all of the accounts/properties/views that use the current page's base URL as the value for Default URL in Property Settings. For example, if the current page you are viewing is www.example.com/index.html, then any property whose Default URL is www.example.com is included in this menu.
Settings
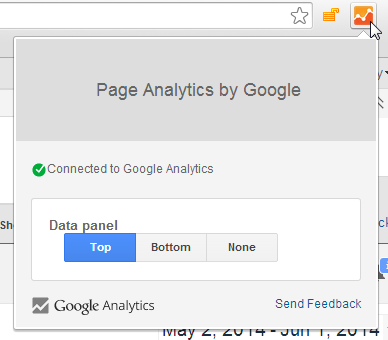
Click the icon for the extension at the top of your browser.
Select whether you want the data panel (scorecards) to appear at the top or bottom of the browser window, or not at all.
You see messages to let you know whether the extension has been able to connect to Analytics, and whether you have access to Analytics data for the page you are viewing.
Disable
Click the x to disable the extension. The controls and scorecards are not visible until you enable them again via the Settings option above.

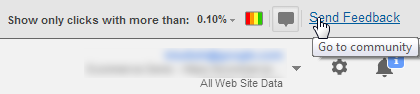
Feedback
Submit feedback to a Google+ community about issues you are having with the extension, improvements you'd like to see.