Use the Events Flow report to visualize the order in which users trigger the Events on your site. Events let you track special content like videos, downloadable items, and embedded gadgets. The Events Flow report can help you discover which Event content keeps users engaged with your site, and see the paths users take from one popular Event to the next.
In this article:Event Flow report prerequisites
You must have set up Events to use the Events Flow report.
Access the Events Flow report
To see the Events Flow report:
- Sign in to Google Analytics.
- Navigate to your view.
- Open Reports.
- Select Behavior > Events > Events Flow.
What can I do with the Events Flow report?
Use the Events Flow Report to investigate questions like:
- Is there an Event that is always triggered first? Does it lead users to more Events?
- Is there an Event that’s triggered multiple times in a session?
- Is there a Category of Events that’s more popular than another type of Event - are videos triggered more frequently and lead to more engagement than gadgets?
- Using Default or Segments, is there a type of user that triggers Events differently than other segments?
How to use the Events Flow report
Each node in the Events Flow report represents an Event triggered by a user. Nodes are organized into columns that reflect the order in which users triggered Events on your site, but there isn’t an inherent order to how nodes appear in the report. For example, all Events in the first column of the flow represent any Event that users triggered before other Events. Events in the second column were triggered second, and so on through the report. Events triggered most frequently appear closer to the top of each column and those triggered less often appear towards the bottom.
Change the level of detail
Use the Level of detail drop-down menu to change the report display.
The Adjust the number of connections displayed in the graph slider increases or decreases the connections between nodes, giving you a finer- or coarser-grained view of the Events flow.
You can organize the report by grouping Events into nodes based on Category, Category/Action, or Category/Action/Label, using the Select the level of detail for event nodes options. These classifications and what you see in the report are based on the way you set up your Events. The more organized you are about setting up your Categories, Actions, and Labels in your Events, the easier it will be to read and interpret this flow report. You may, for example, want to put all of your videos and downloadable items into different Categories and use Actions and Labels to further differentiate between individual Events.

Examine nodes and connections
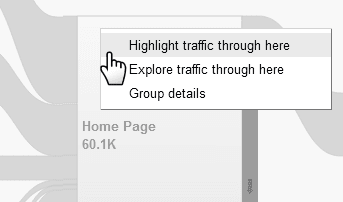
Click a node to display a context menu, letting you investigate traffic flowing to and from a particular Event. Click a connection to highlight only the Events related to that connection.
Scroll the report and add or remove steps
Click and drag the report left or right to scroll sideways. Scroll all the way to the right, then click +Step to add Events to the sequence. Remove Events with the x at the top of each column.
Examine Event exits
Click a red node exit bar to see exit details for that node. Note that exits in this report don’t necessarily indicate exits from your site; rather, exits only show that a traffic segment didn’t trigger another Event.

Next steps
For more information about how to configure the report and use the different visualization options, read Using Flow reports.
After looking at the report, take a look at the Events on your site to see them from a user's perspective. If you find Events that are particularly popular or lead to engagement with more Events, you may want to create more content like that. If you find an Event that is triggered multiple times in a row, you may discover that content isn’t working properly and the multiple triggers may correspond to frequent reloading. You may also find that a certain segment of traffic responds better to some Events than others.
Once you discover how users interact with the special site content that you track as Events, leverage this information to gain deeper user engagement with your site.
